
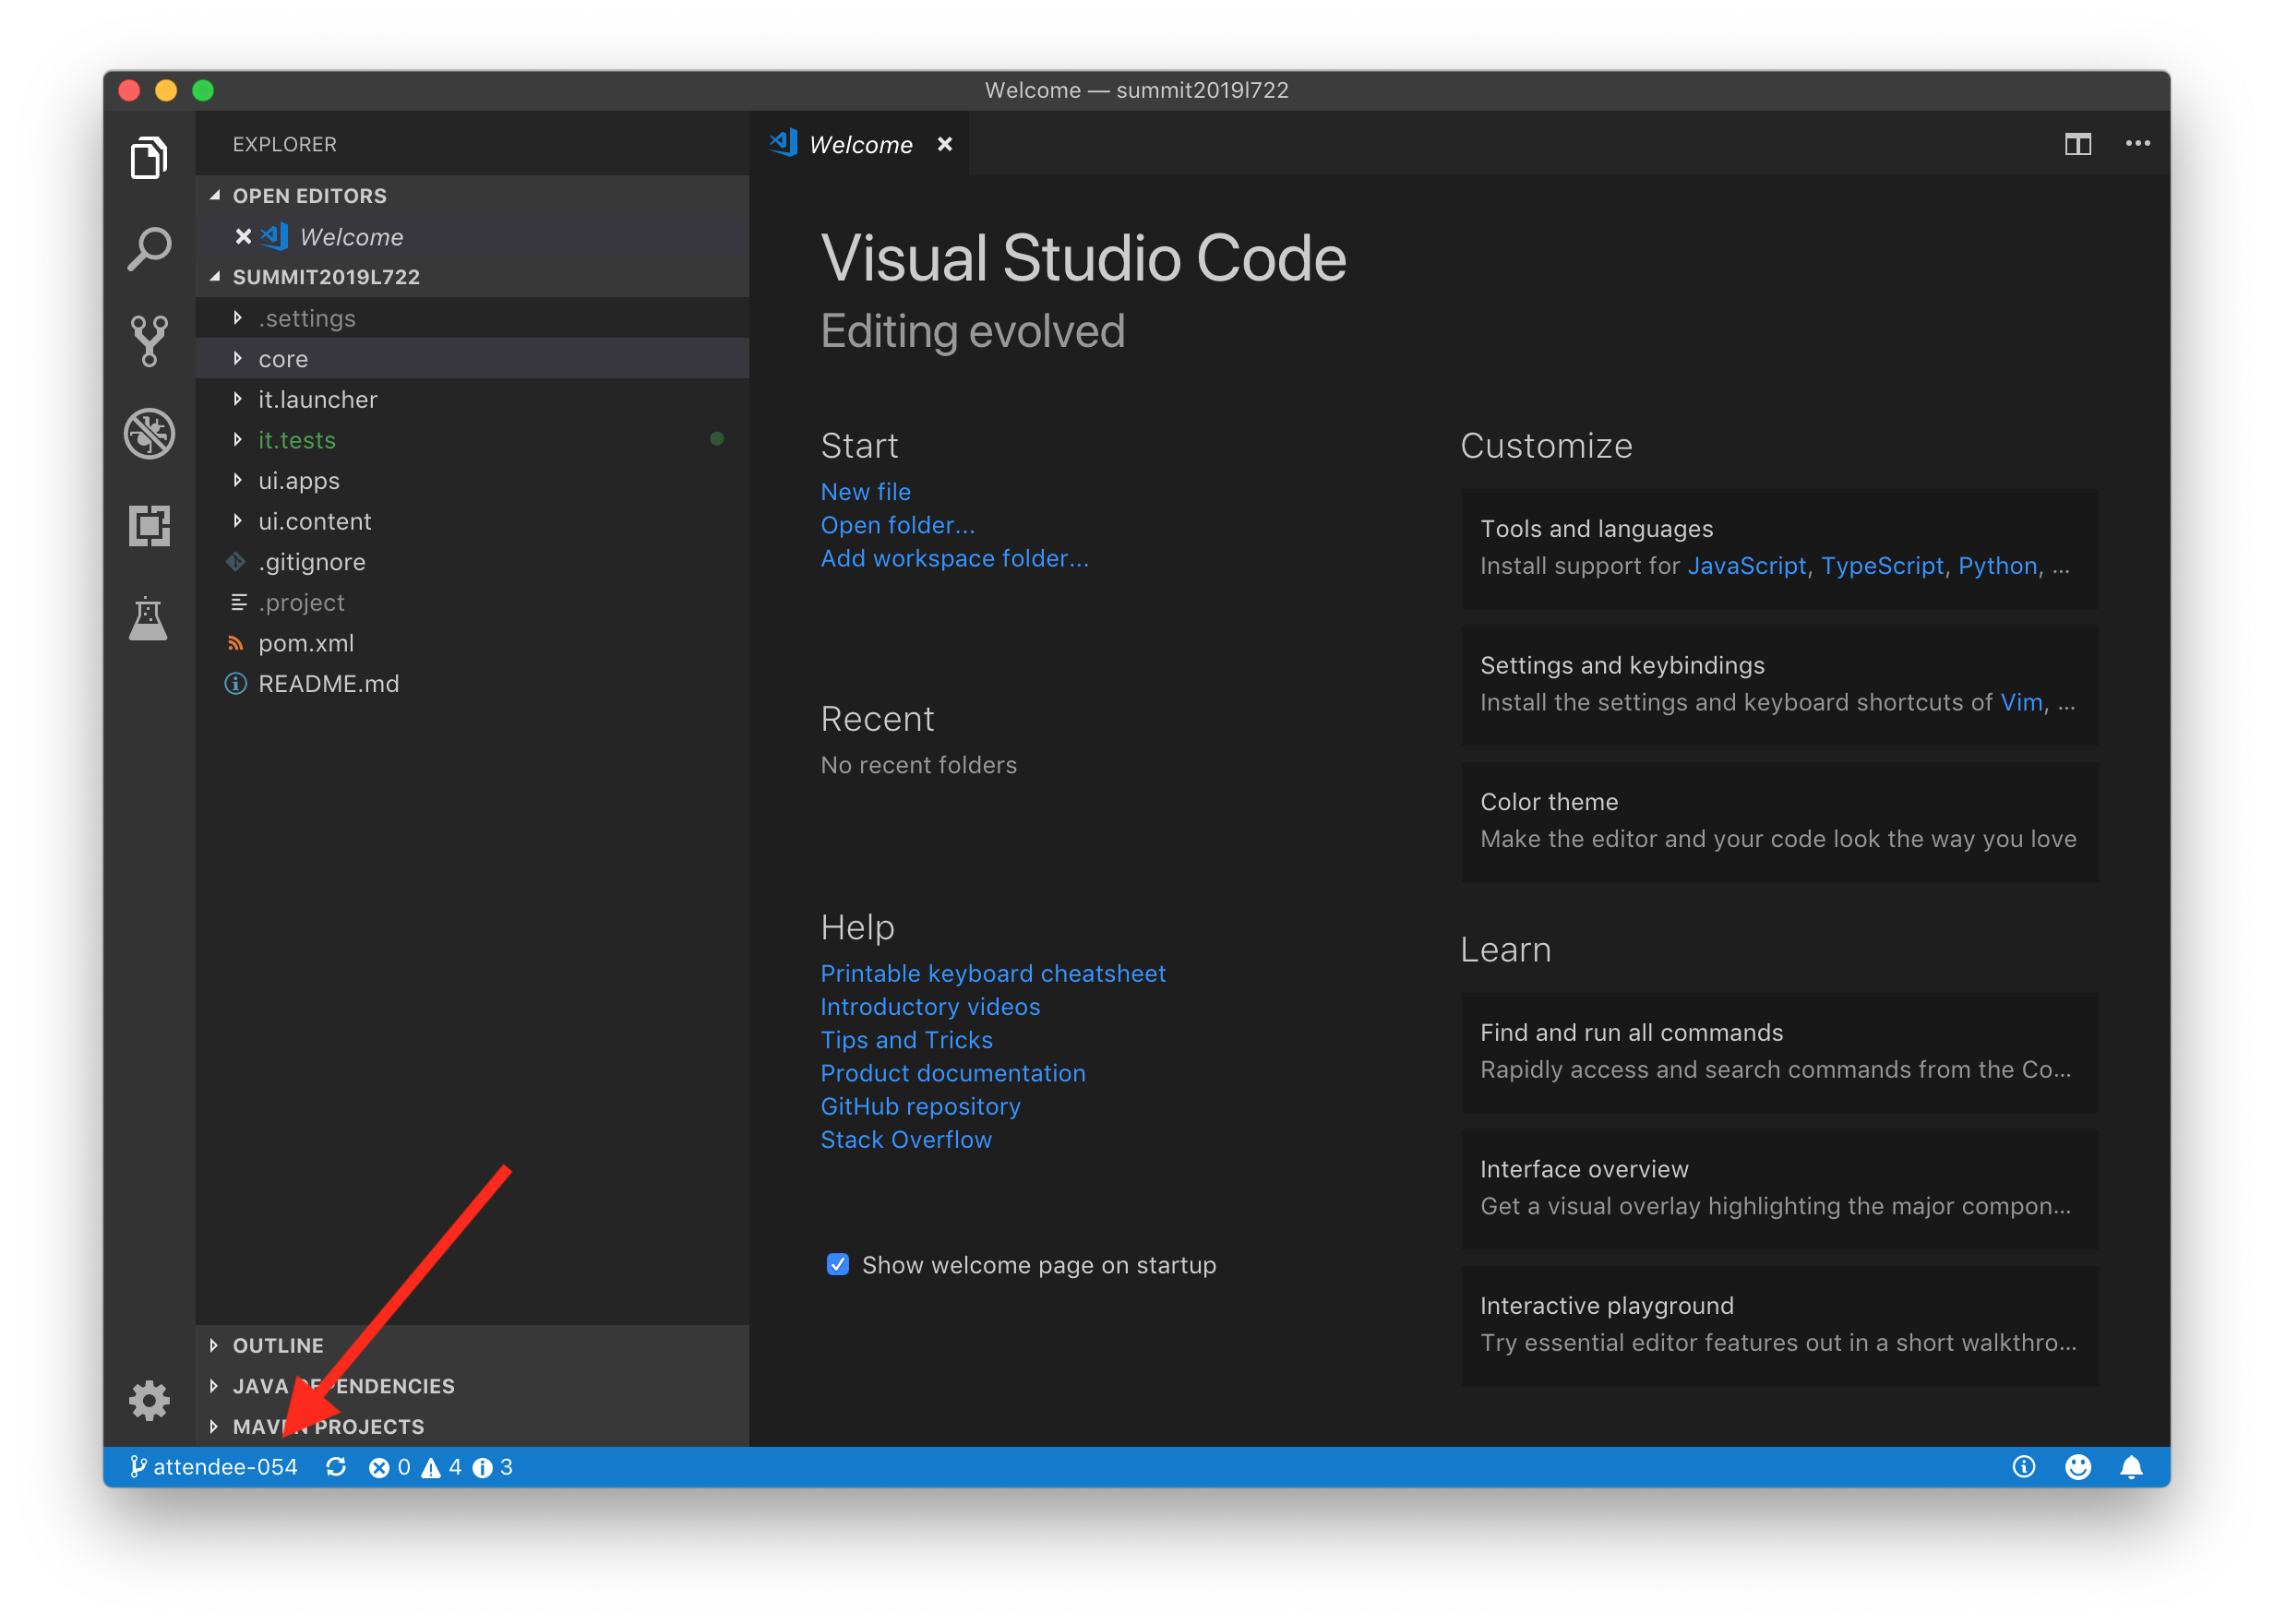
Welcome to the lab "Get Up, Running, and Integrated with Cloud Manager for Experience Manager"! In this lab, we will look at how Cloud Manager helps our customers and partners quickly deploy their custom applications to Adobe-managed Experience Manager environments while ensuring that custom code adheres to both Adobe and industry best practices. We will also explore how external systems (in this case Microsoft Teams) can be integrated with Cloud Manager using our API.
Cloud Manager, first introduced at Summit 2018, is a self-service cloud application which enables our Managed Services customers to deploy, update, monitor, and manage their Experience Manager environments. This lab will be focused on the Continuous Integration / Continuous Delivery (CI/CD) aspect of Cloud Manager. There are other sessions at Summit which address some of the other capabilities of Cloud Manager as well as full reference documentation linked to from the Additional Resources section below.
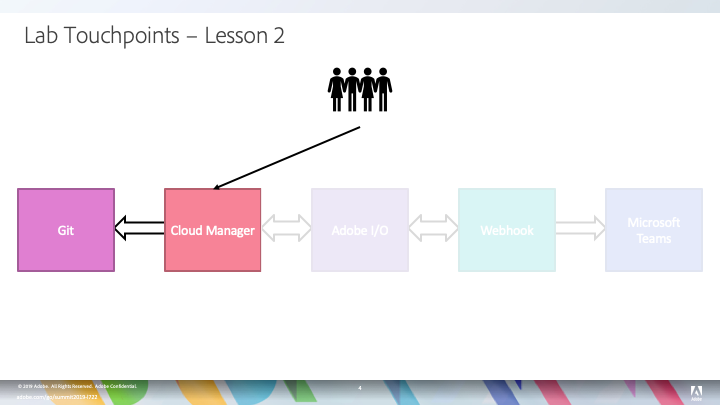
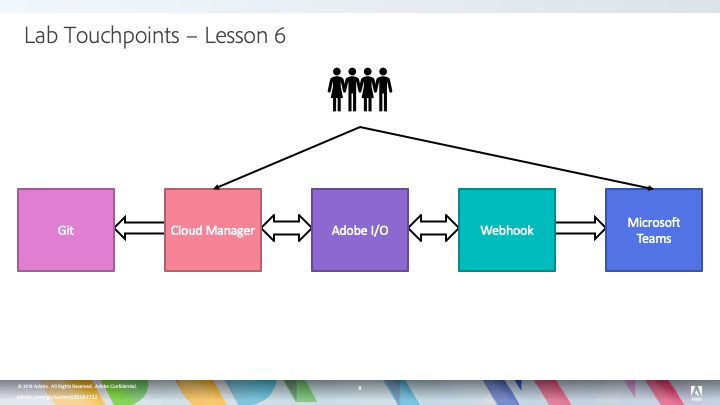
In this lab, we'll be using a number of different tools, so before we get started, let's do a quick overview of what each of these tools does and how we will be using them.
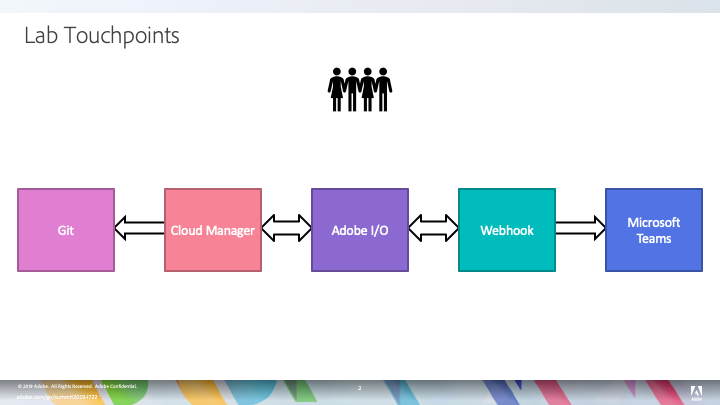
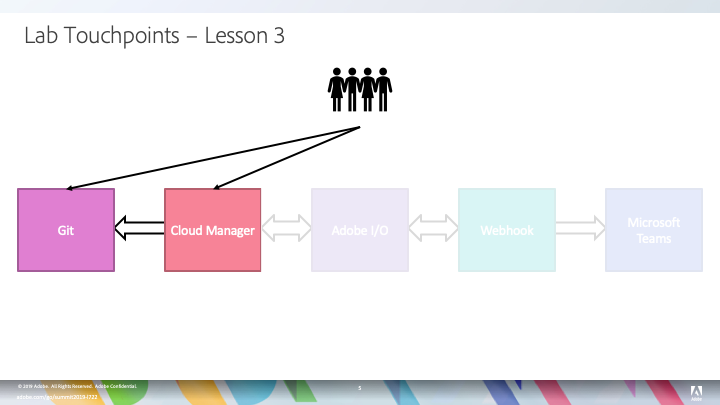
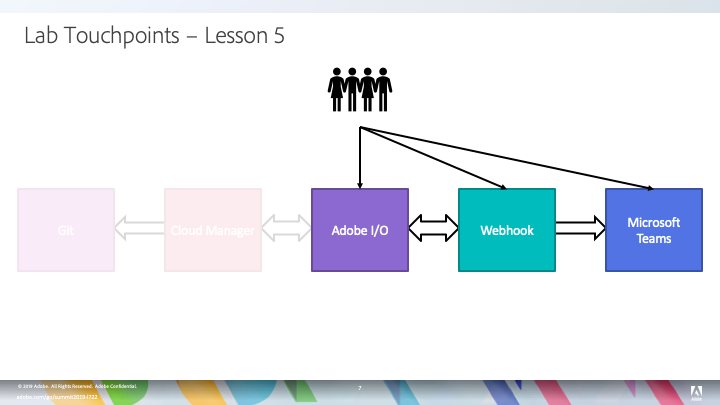
The last item in this picture is a webhook. This is a small piece of software which you'll be configuring, running, and (if you want) modifying which will act as a notification broker between Adobe I/O and Microsoft Teams. Your webhook (created in Lesson 4) will receive notifications from Adobe I/O and then send notifications to Microsoft Teams. In addition to receiving notifications from Adobe I/O, the webhook will make API calls to Adobe I/O to augment the information provided in the initial notification.
As a lab attendee, you have been provisioned with all of the necessary access and software needed to participate in this lab. If you are using this workbook outside of the Summit lab, you'll need the following:
This lesson will start by logging into Cloud Manager through the Experience Cloud. Once logged in, you will create a simple CI/CD pipeline which builds an application project and evaluates the code quality. Pipelines like this can be used throughout the development process to get early and fast feedback.

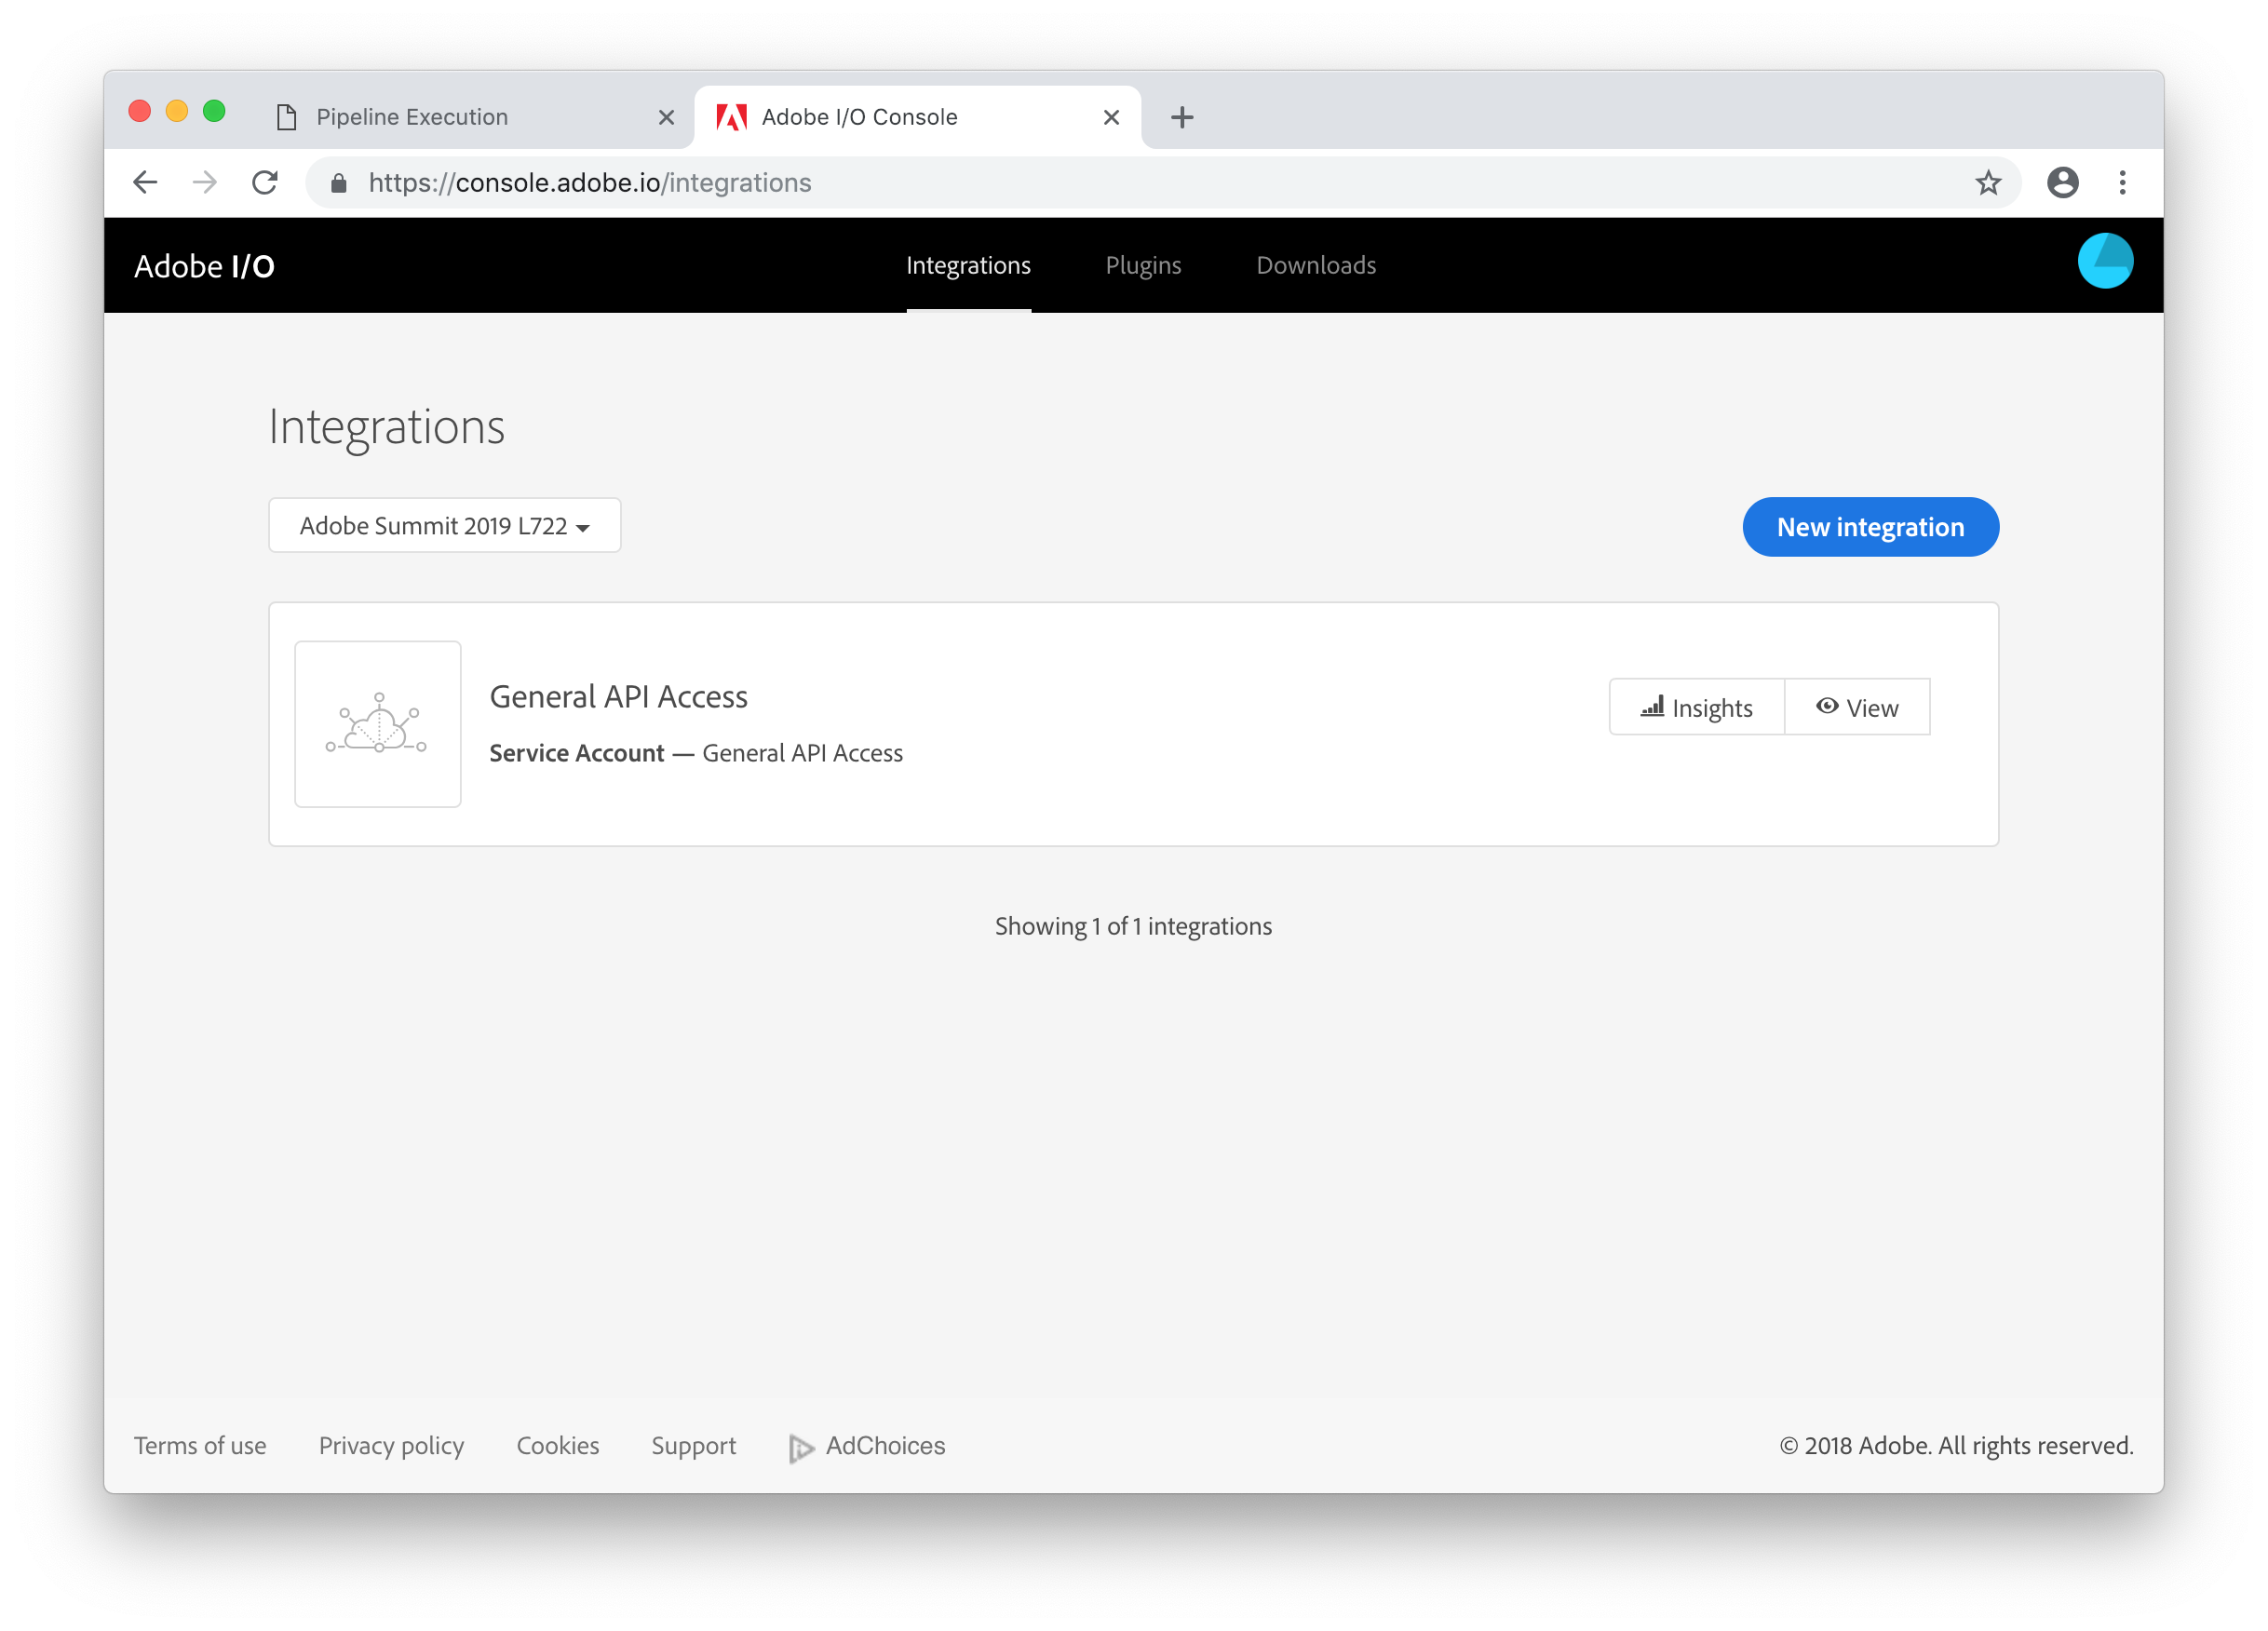
Our lab starts with logging into the Cloud Manager web interface. To start, open Google Chrome. It should automatically present you with the Experience Cloud login page. If not, navigate to https://experiencecloud.adobe.com.
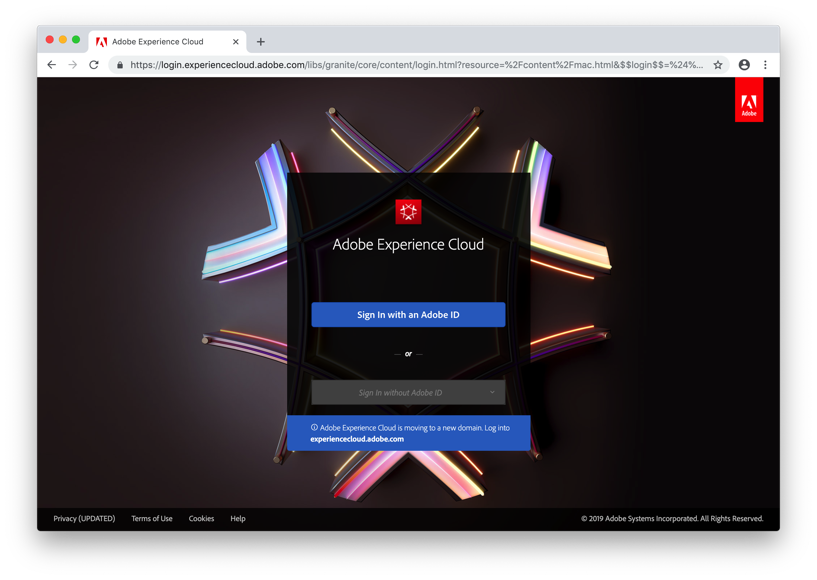
On this page, click the Sign In with an Adobe ID button.
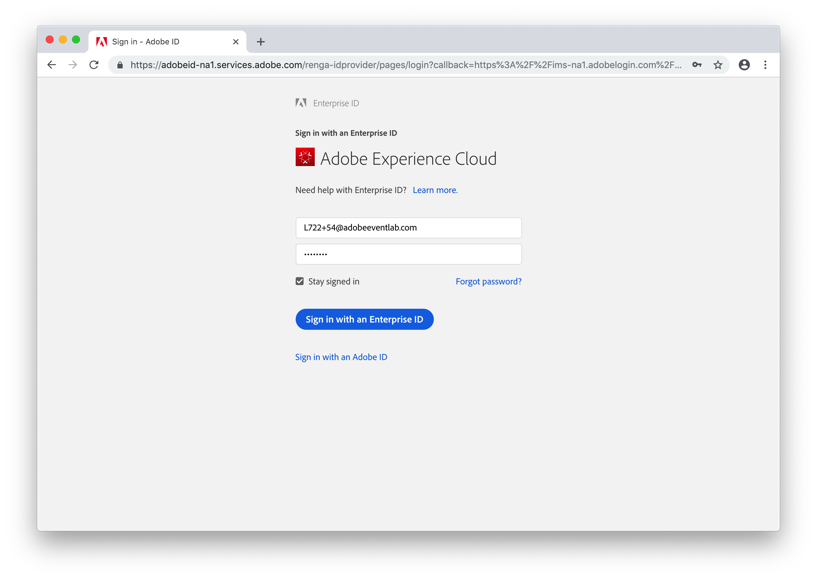
Each attendee has a unique login assigned to them. You should see this on your workstation. Enter that email address and password on the login form and click the Sign in with an Enterprise ID button.
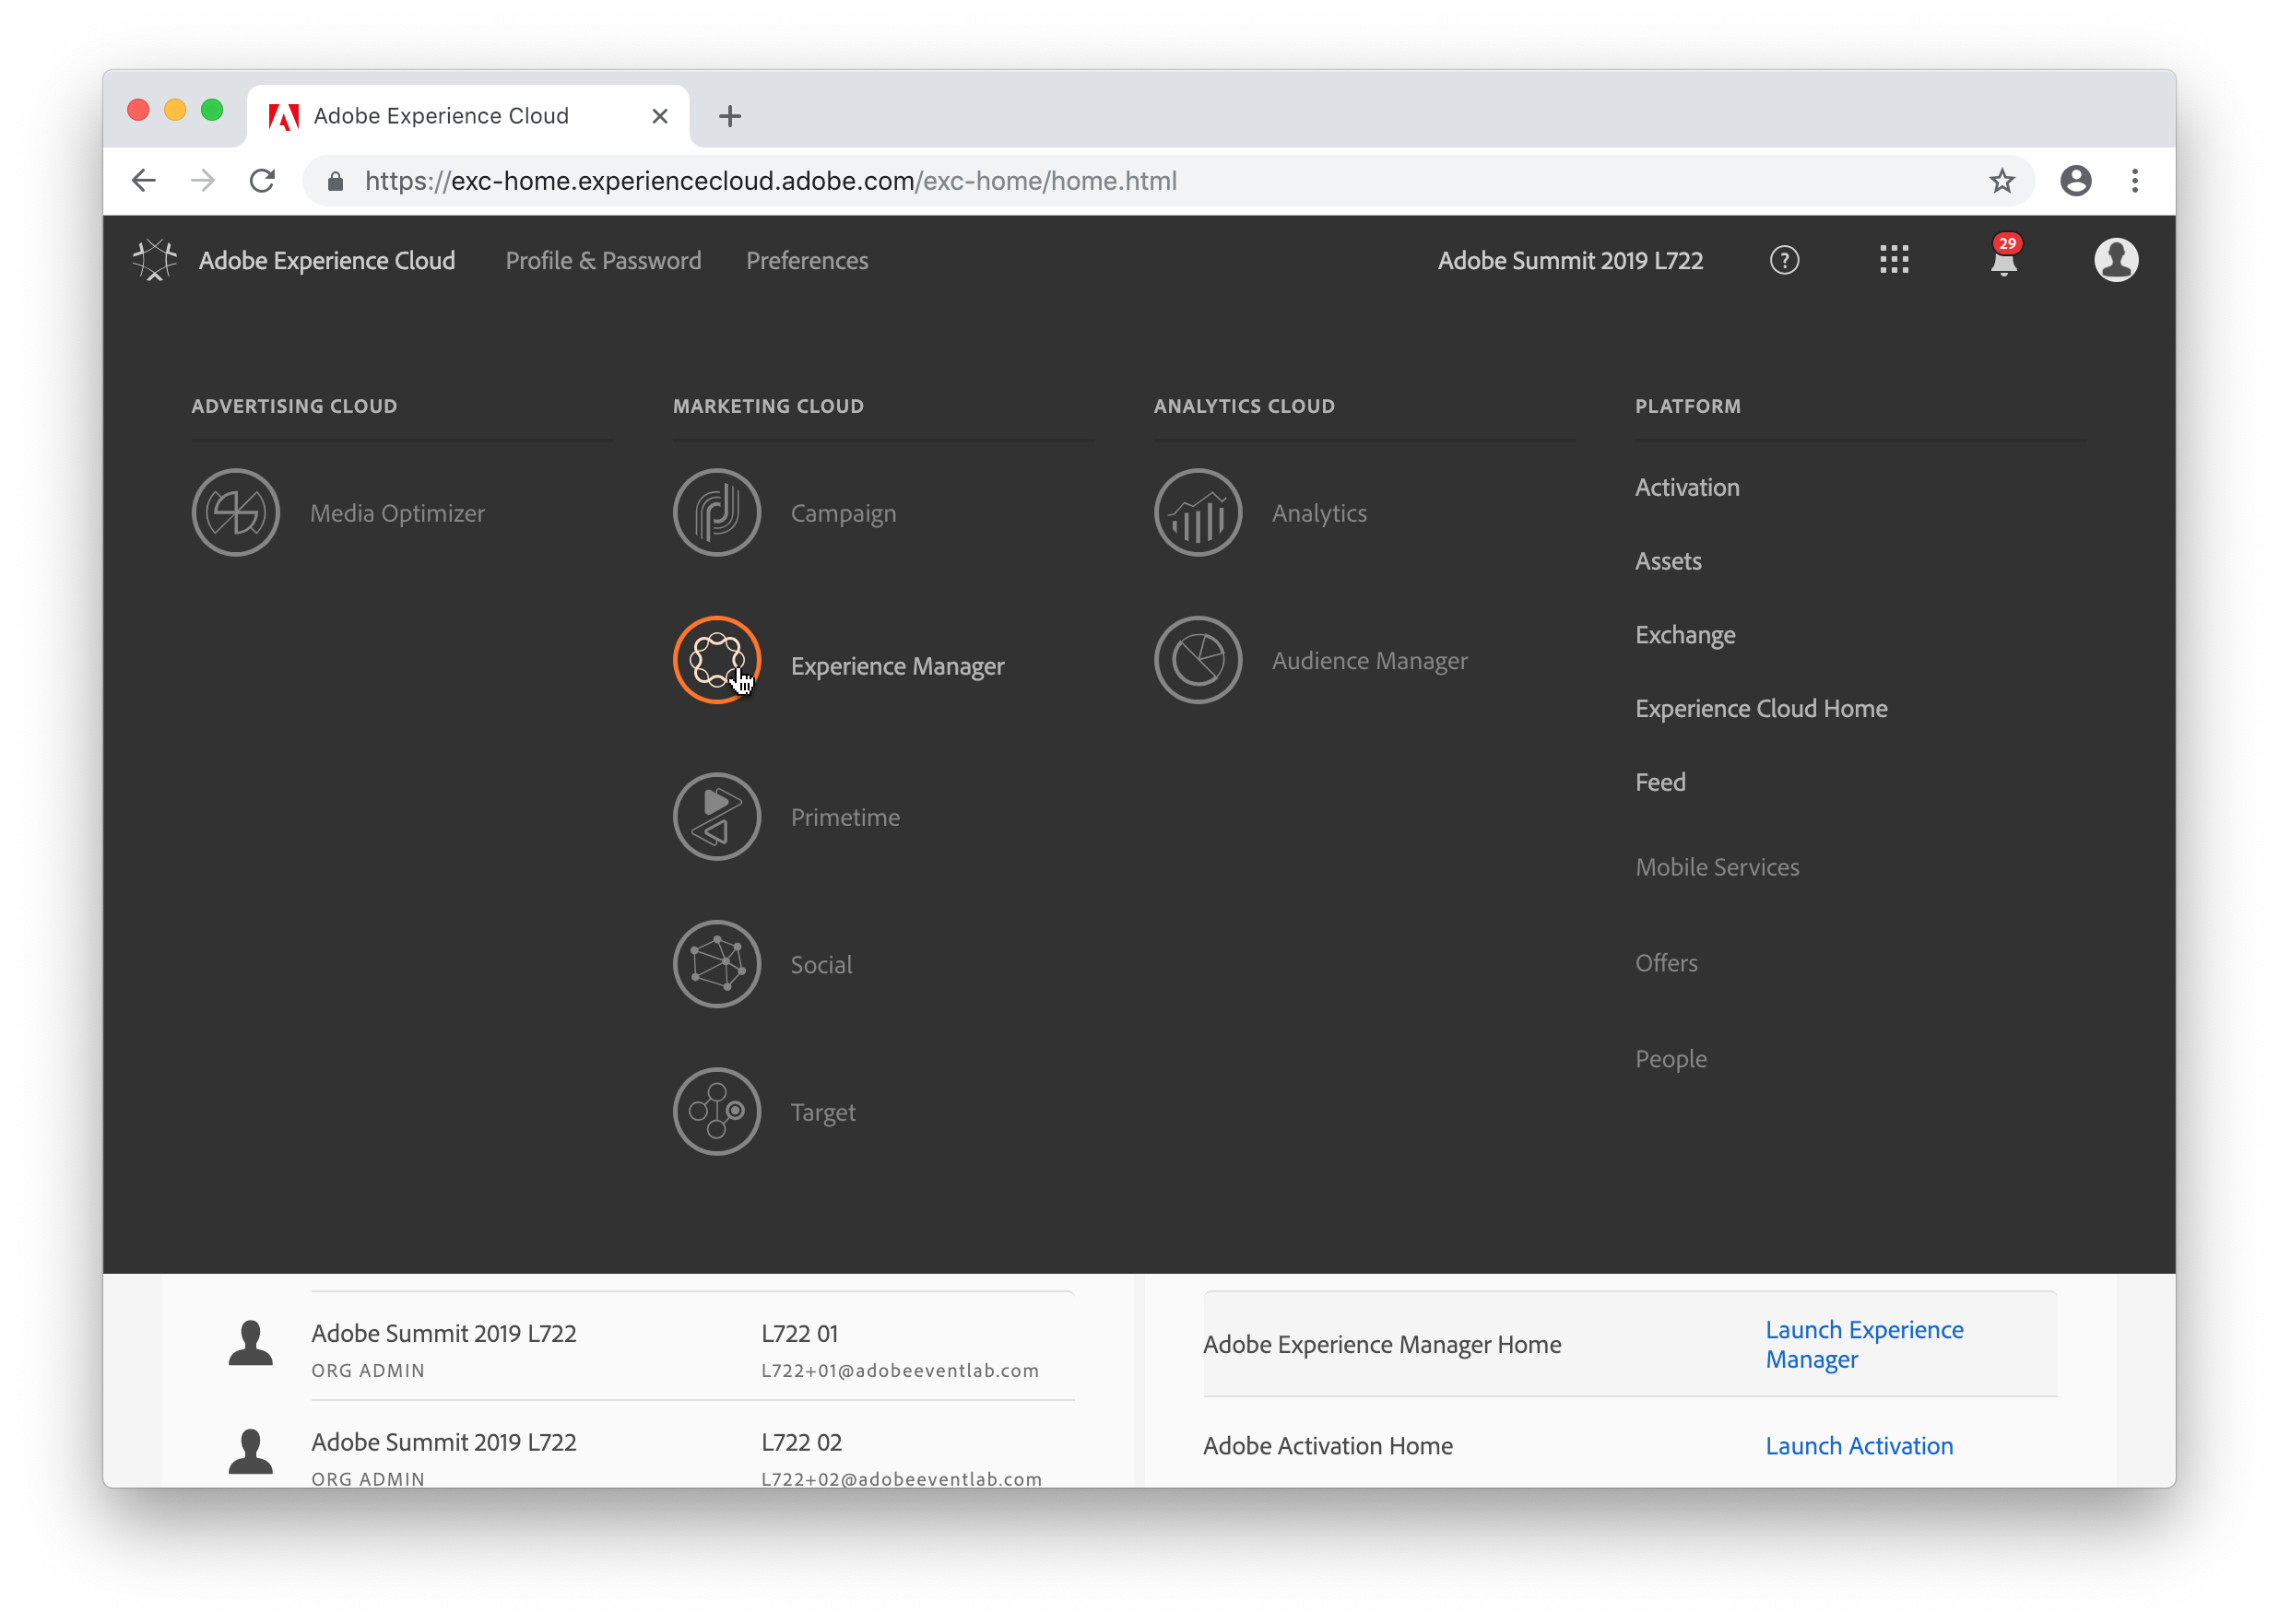
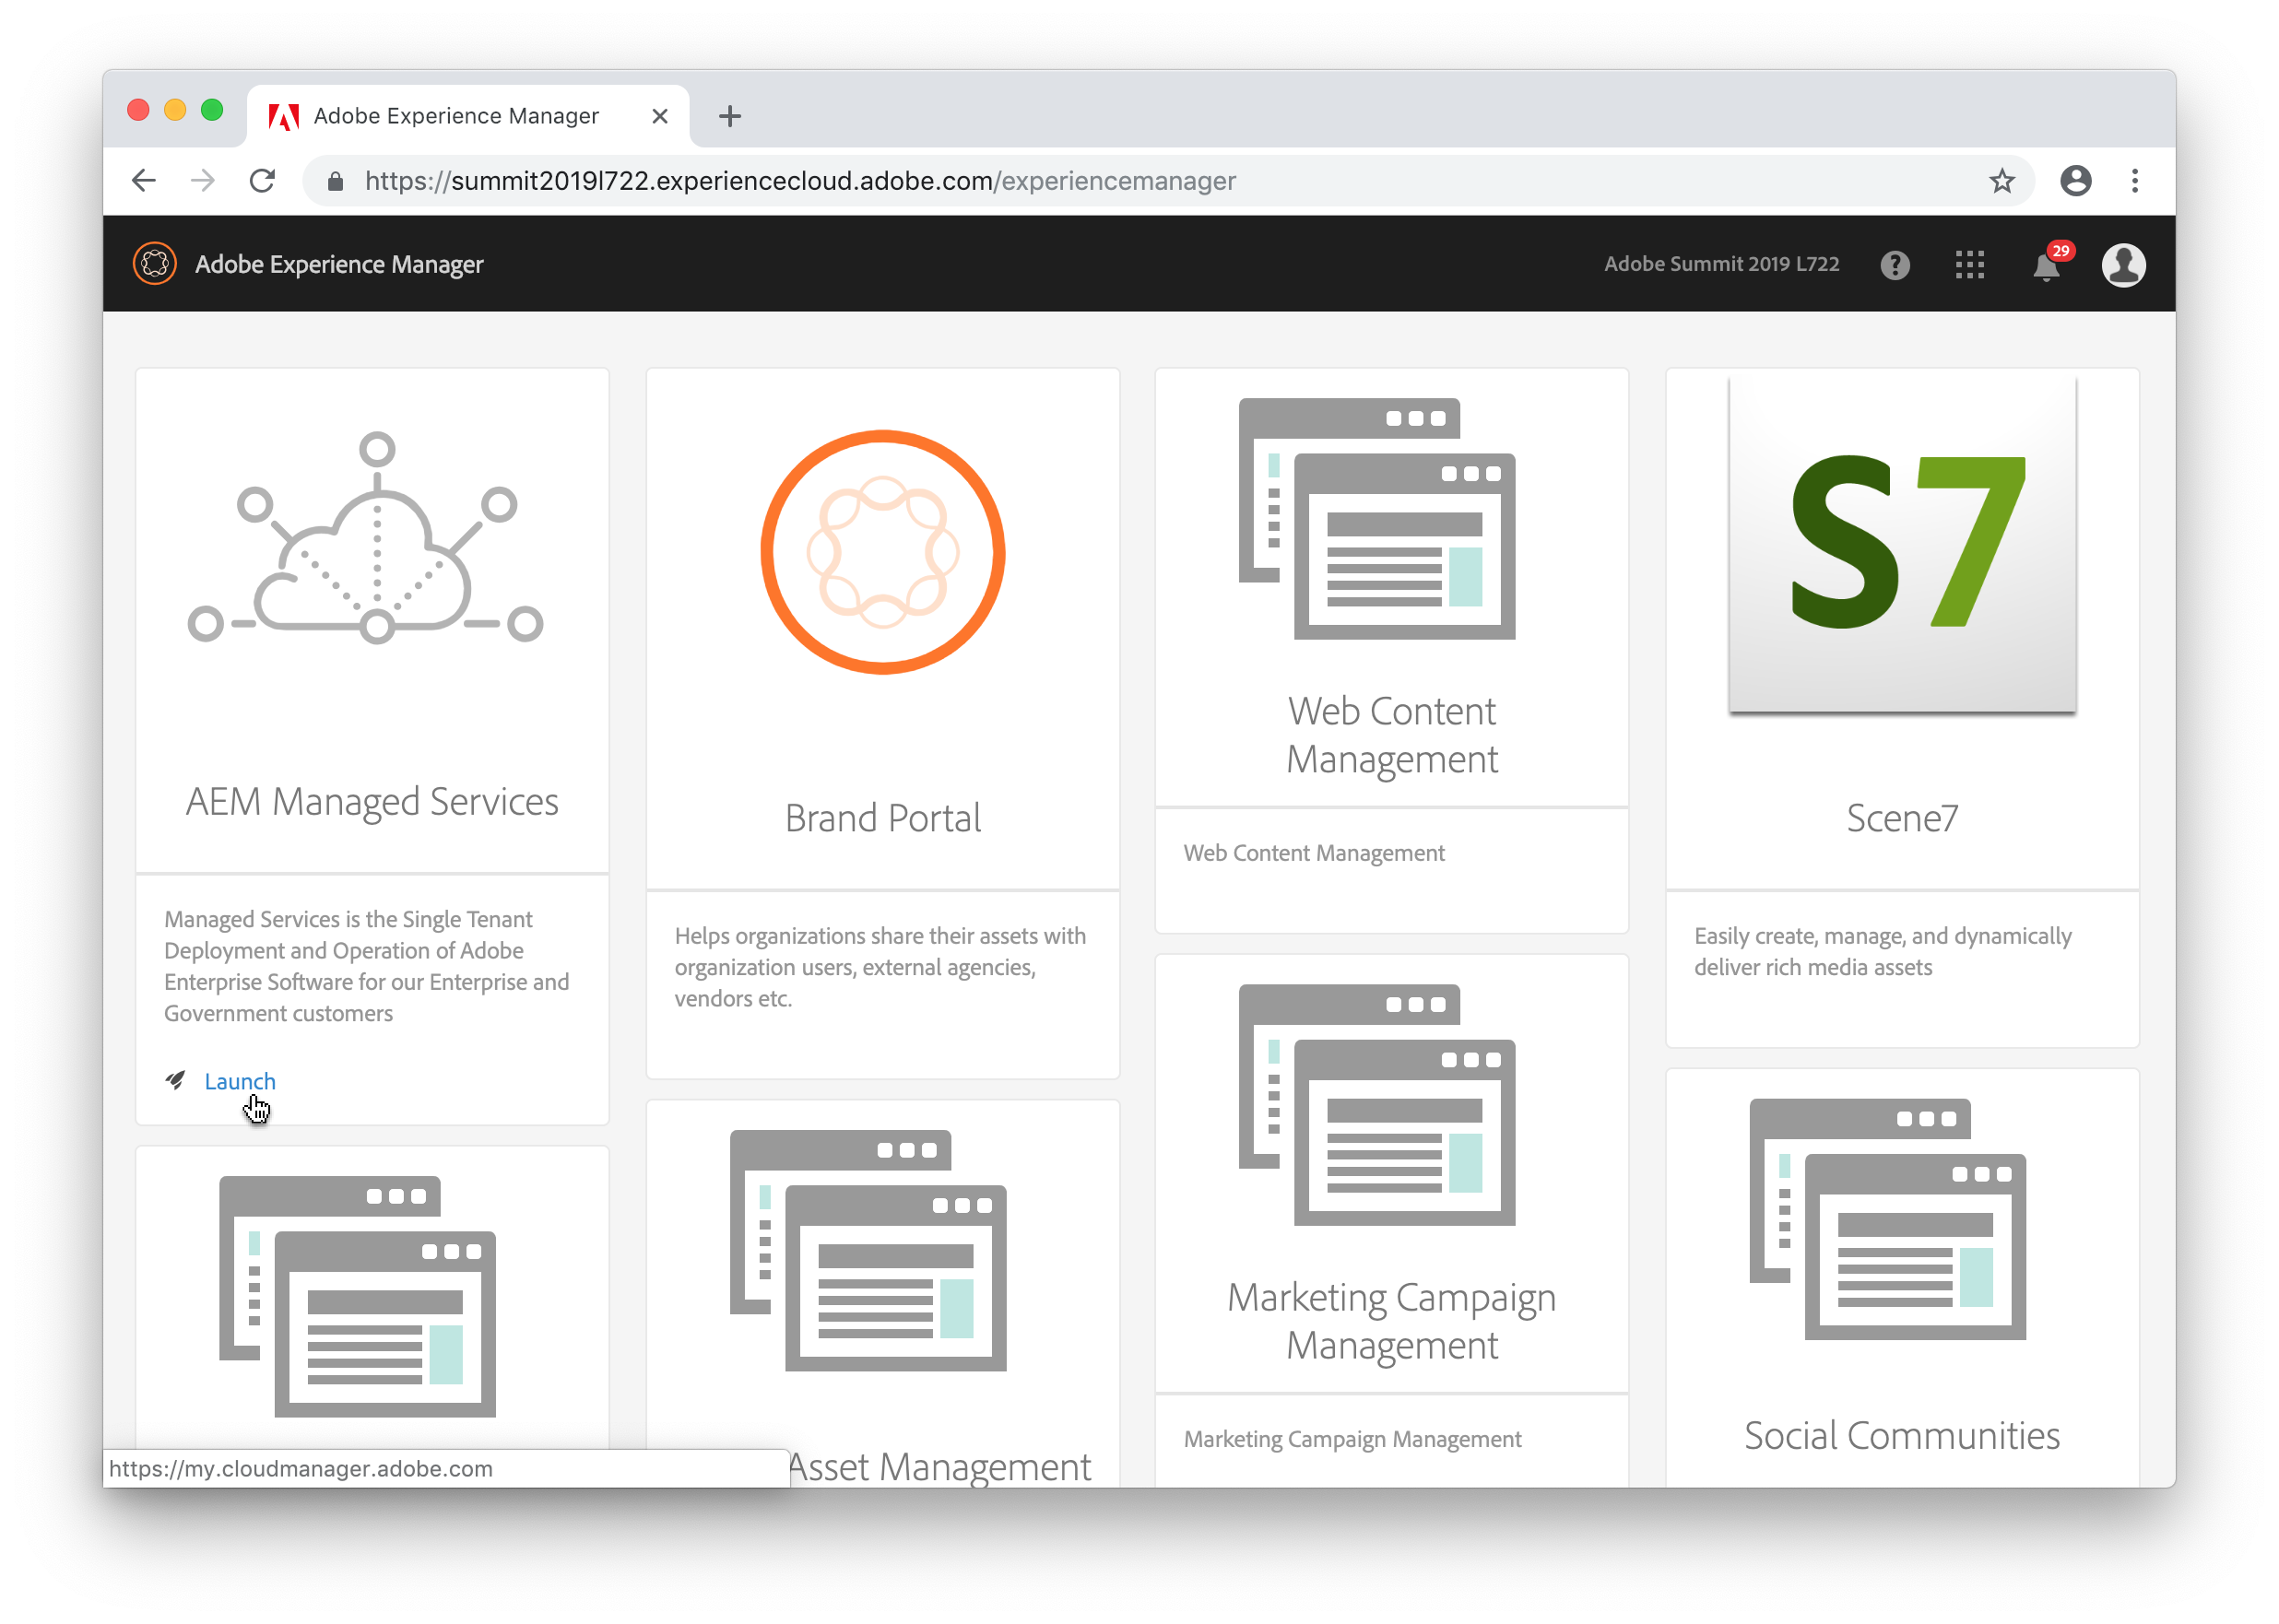
To navigate to Cloud Manager, click the Solution Switcher in the header navigation (the icon is three rows of three squares) and select Experience Manager.
On this screen, click the AEM Managed Services card.
We refer to this screen as the Program Switcher. Many of our Managed Services customers have multiple programs under a single enterprise organization. For example, you might have one set of environments for an Enterprise DAM, another set for your public-facing websites, and another set for an employee or partner portal. Cloud Manager groups these into separate programs. For the purpose of this lab, we only have a single program (We.Retail Intranet). To navigate to the Cloud Manager overview page for that program, hover over the card and click on the Cloud Manager icon (it will be the first icon on the left).
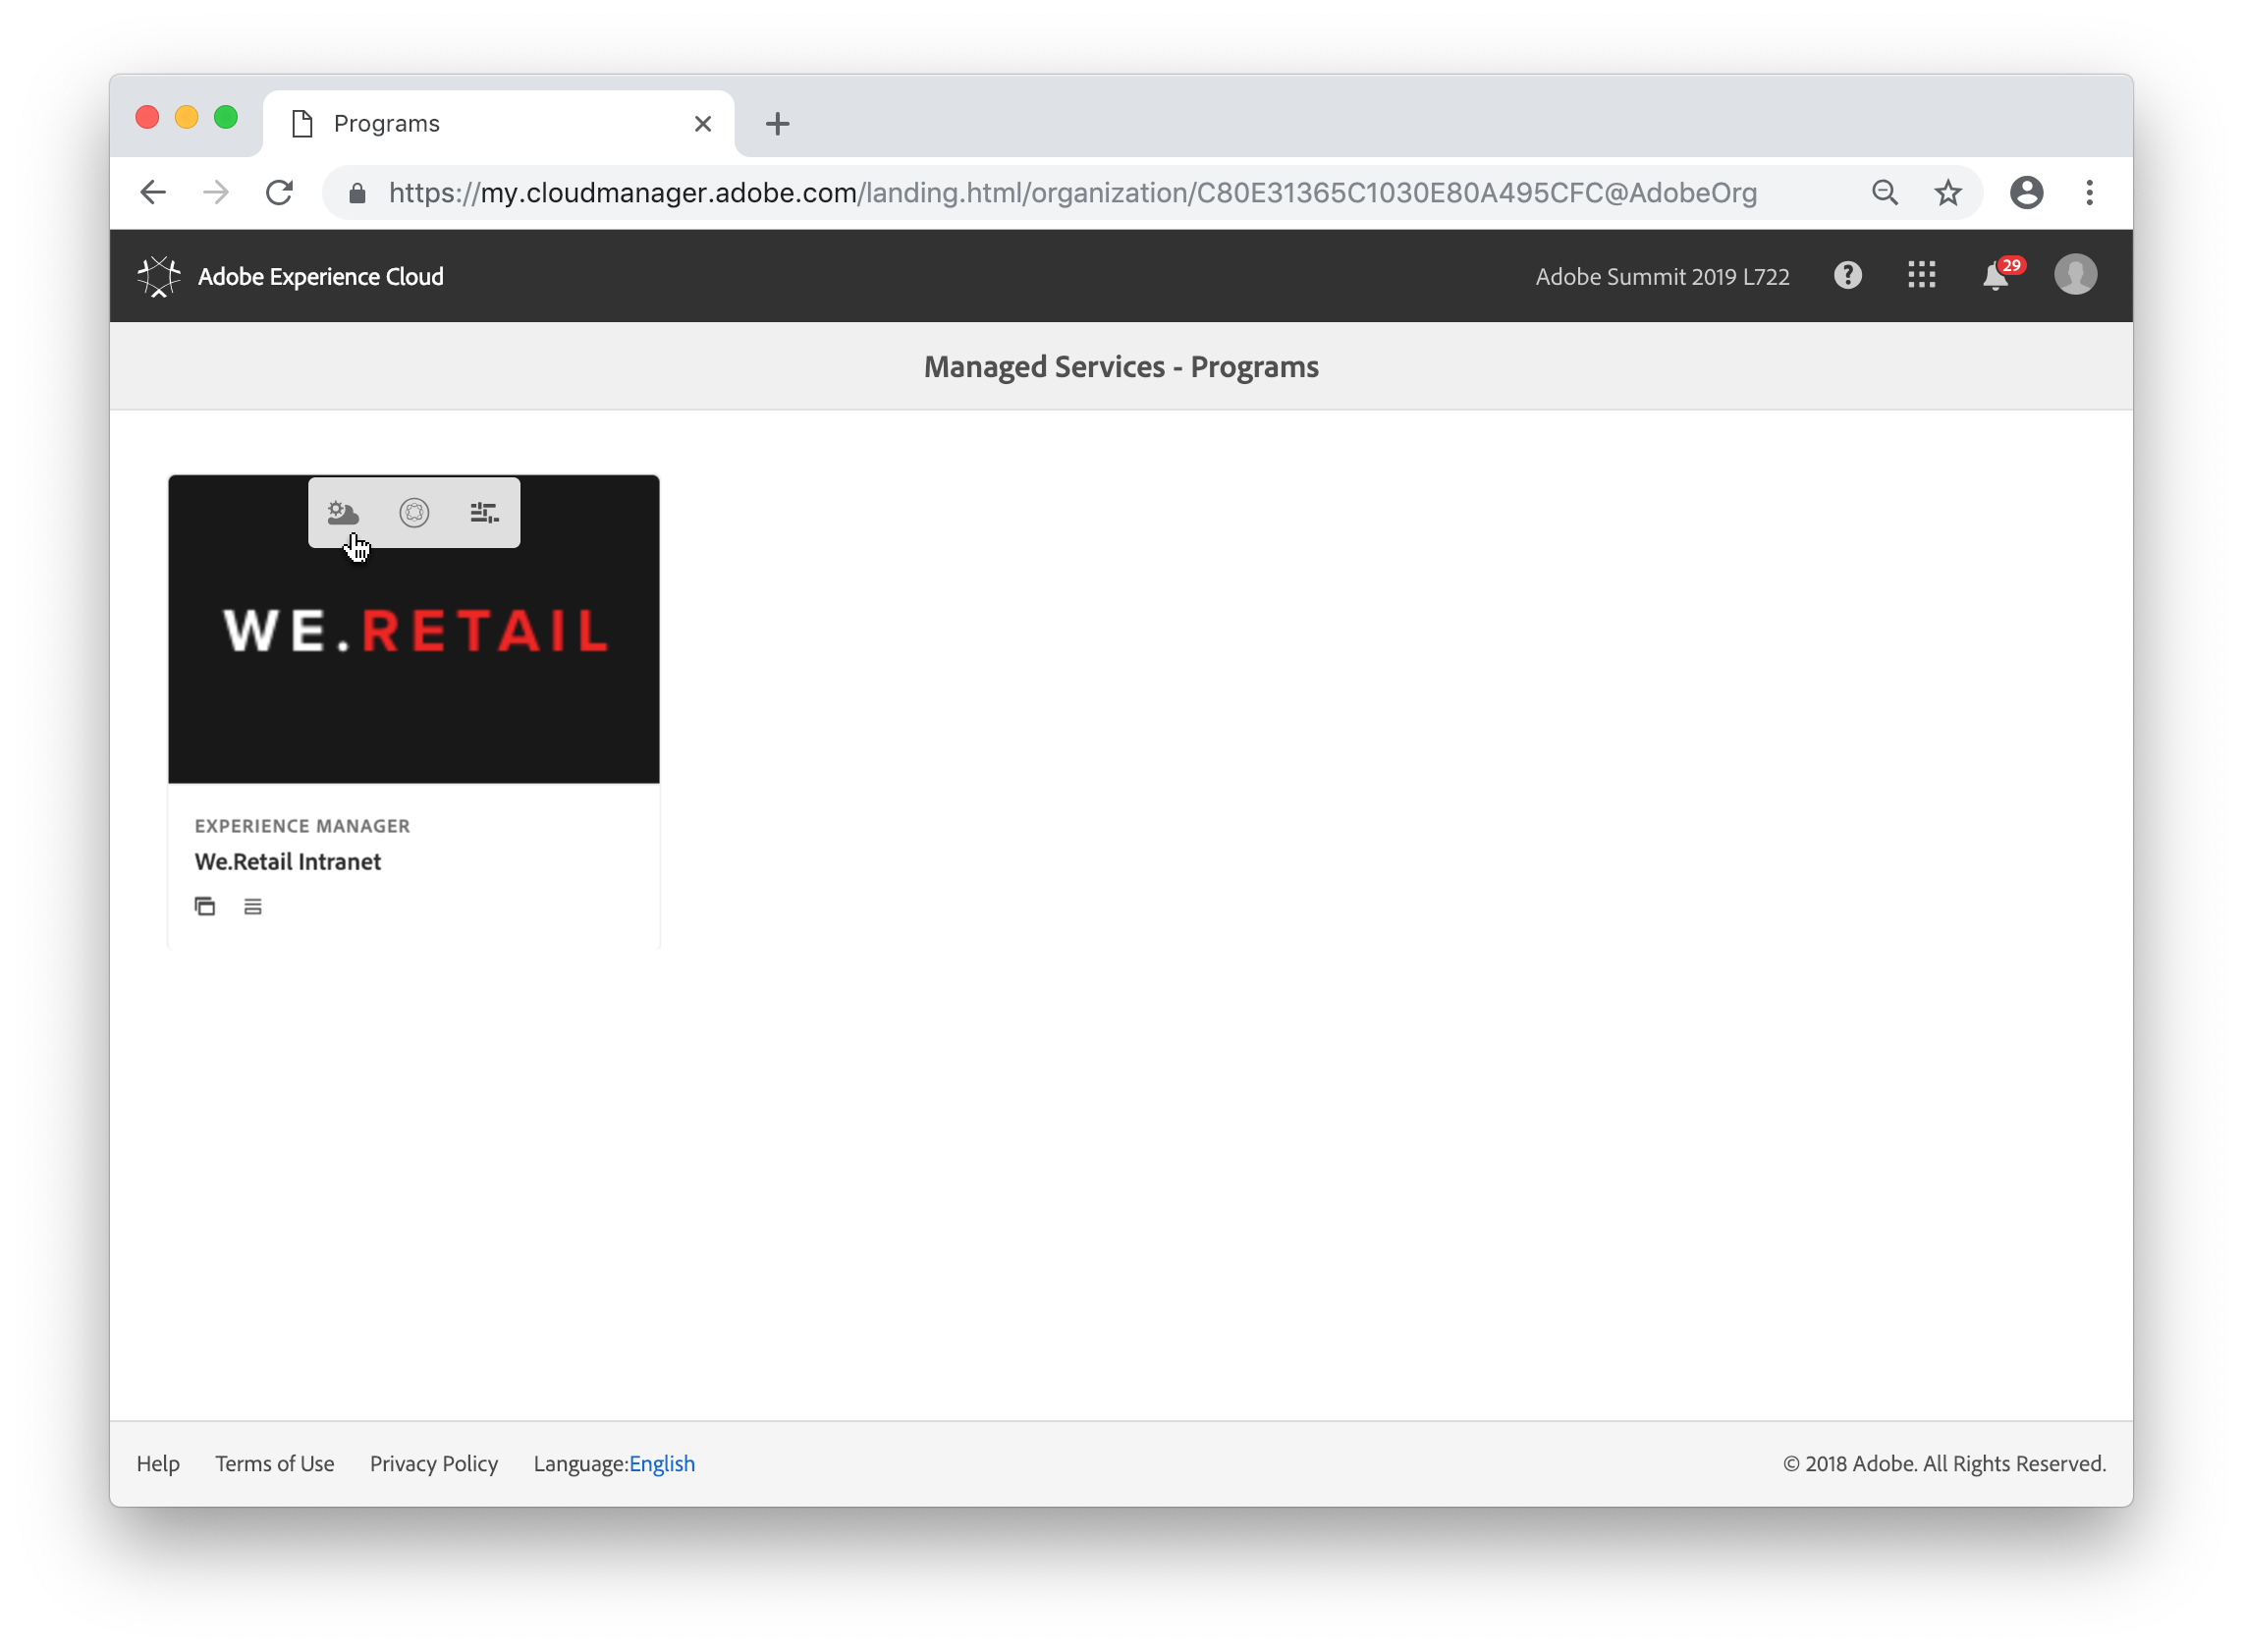
If you click on the card itself, you will get an error message stating that the AEM Link cannot be found. Under normal circumstances, clicking on the card will navigate to the production AEM author instance. For the purpose of this lab, there is no production author instance, so this link is non-functional.
Cloud Manager supports multiple types of CI/CD pipelines. The primary pipeline builds a customer application project, runs a series of code quality checks, deploys that project to a staging environment, runs security and performance tests, and finally deploys to the production environment. Additional pipelines may be created to deploy to other non-production environments, e.g. a development environment. There is also support for what we refer to as "Code Quality Only" pipelines which only execute the build and code quality checks. These pipelines are useful to verify code quality during a development cycle and are especially relevant for customers who do not have a separate development environment hosted by Adobe.
For the purpose of this lab, we will be using a Code Quality Only pipeline primarily for the purpose of speed -- it does the least and thus takes the least amount of time.
That said, if you are using this workbook outside of Summit and have the environments available, feel free to use a different pipeline type; it doesn't actually impact the lab content significantly.
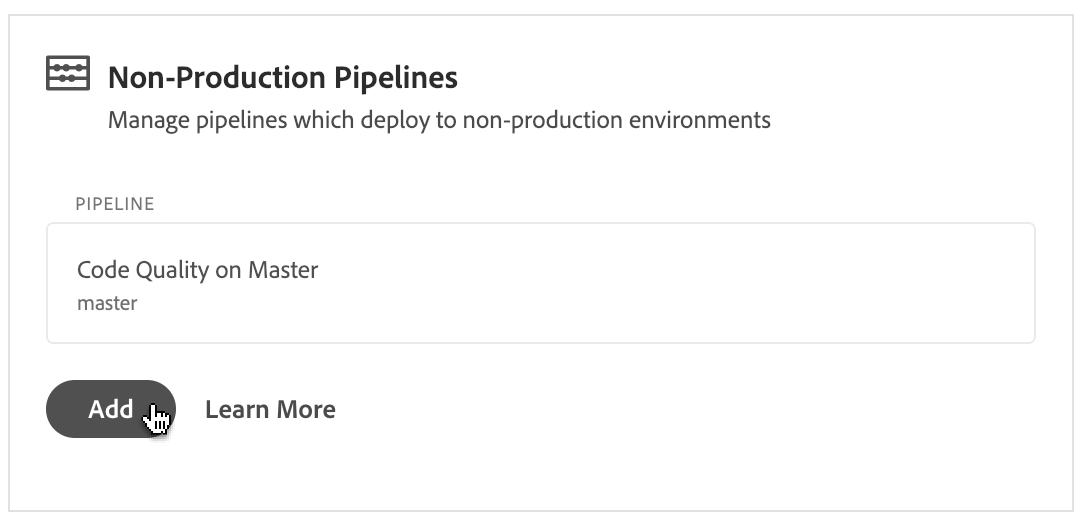
To start, click the Add button in the Non-Production pipelines card.
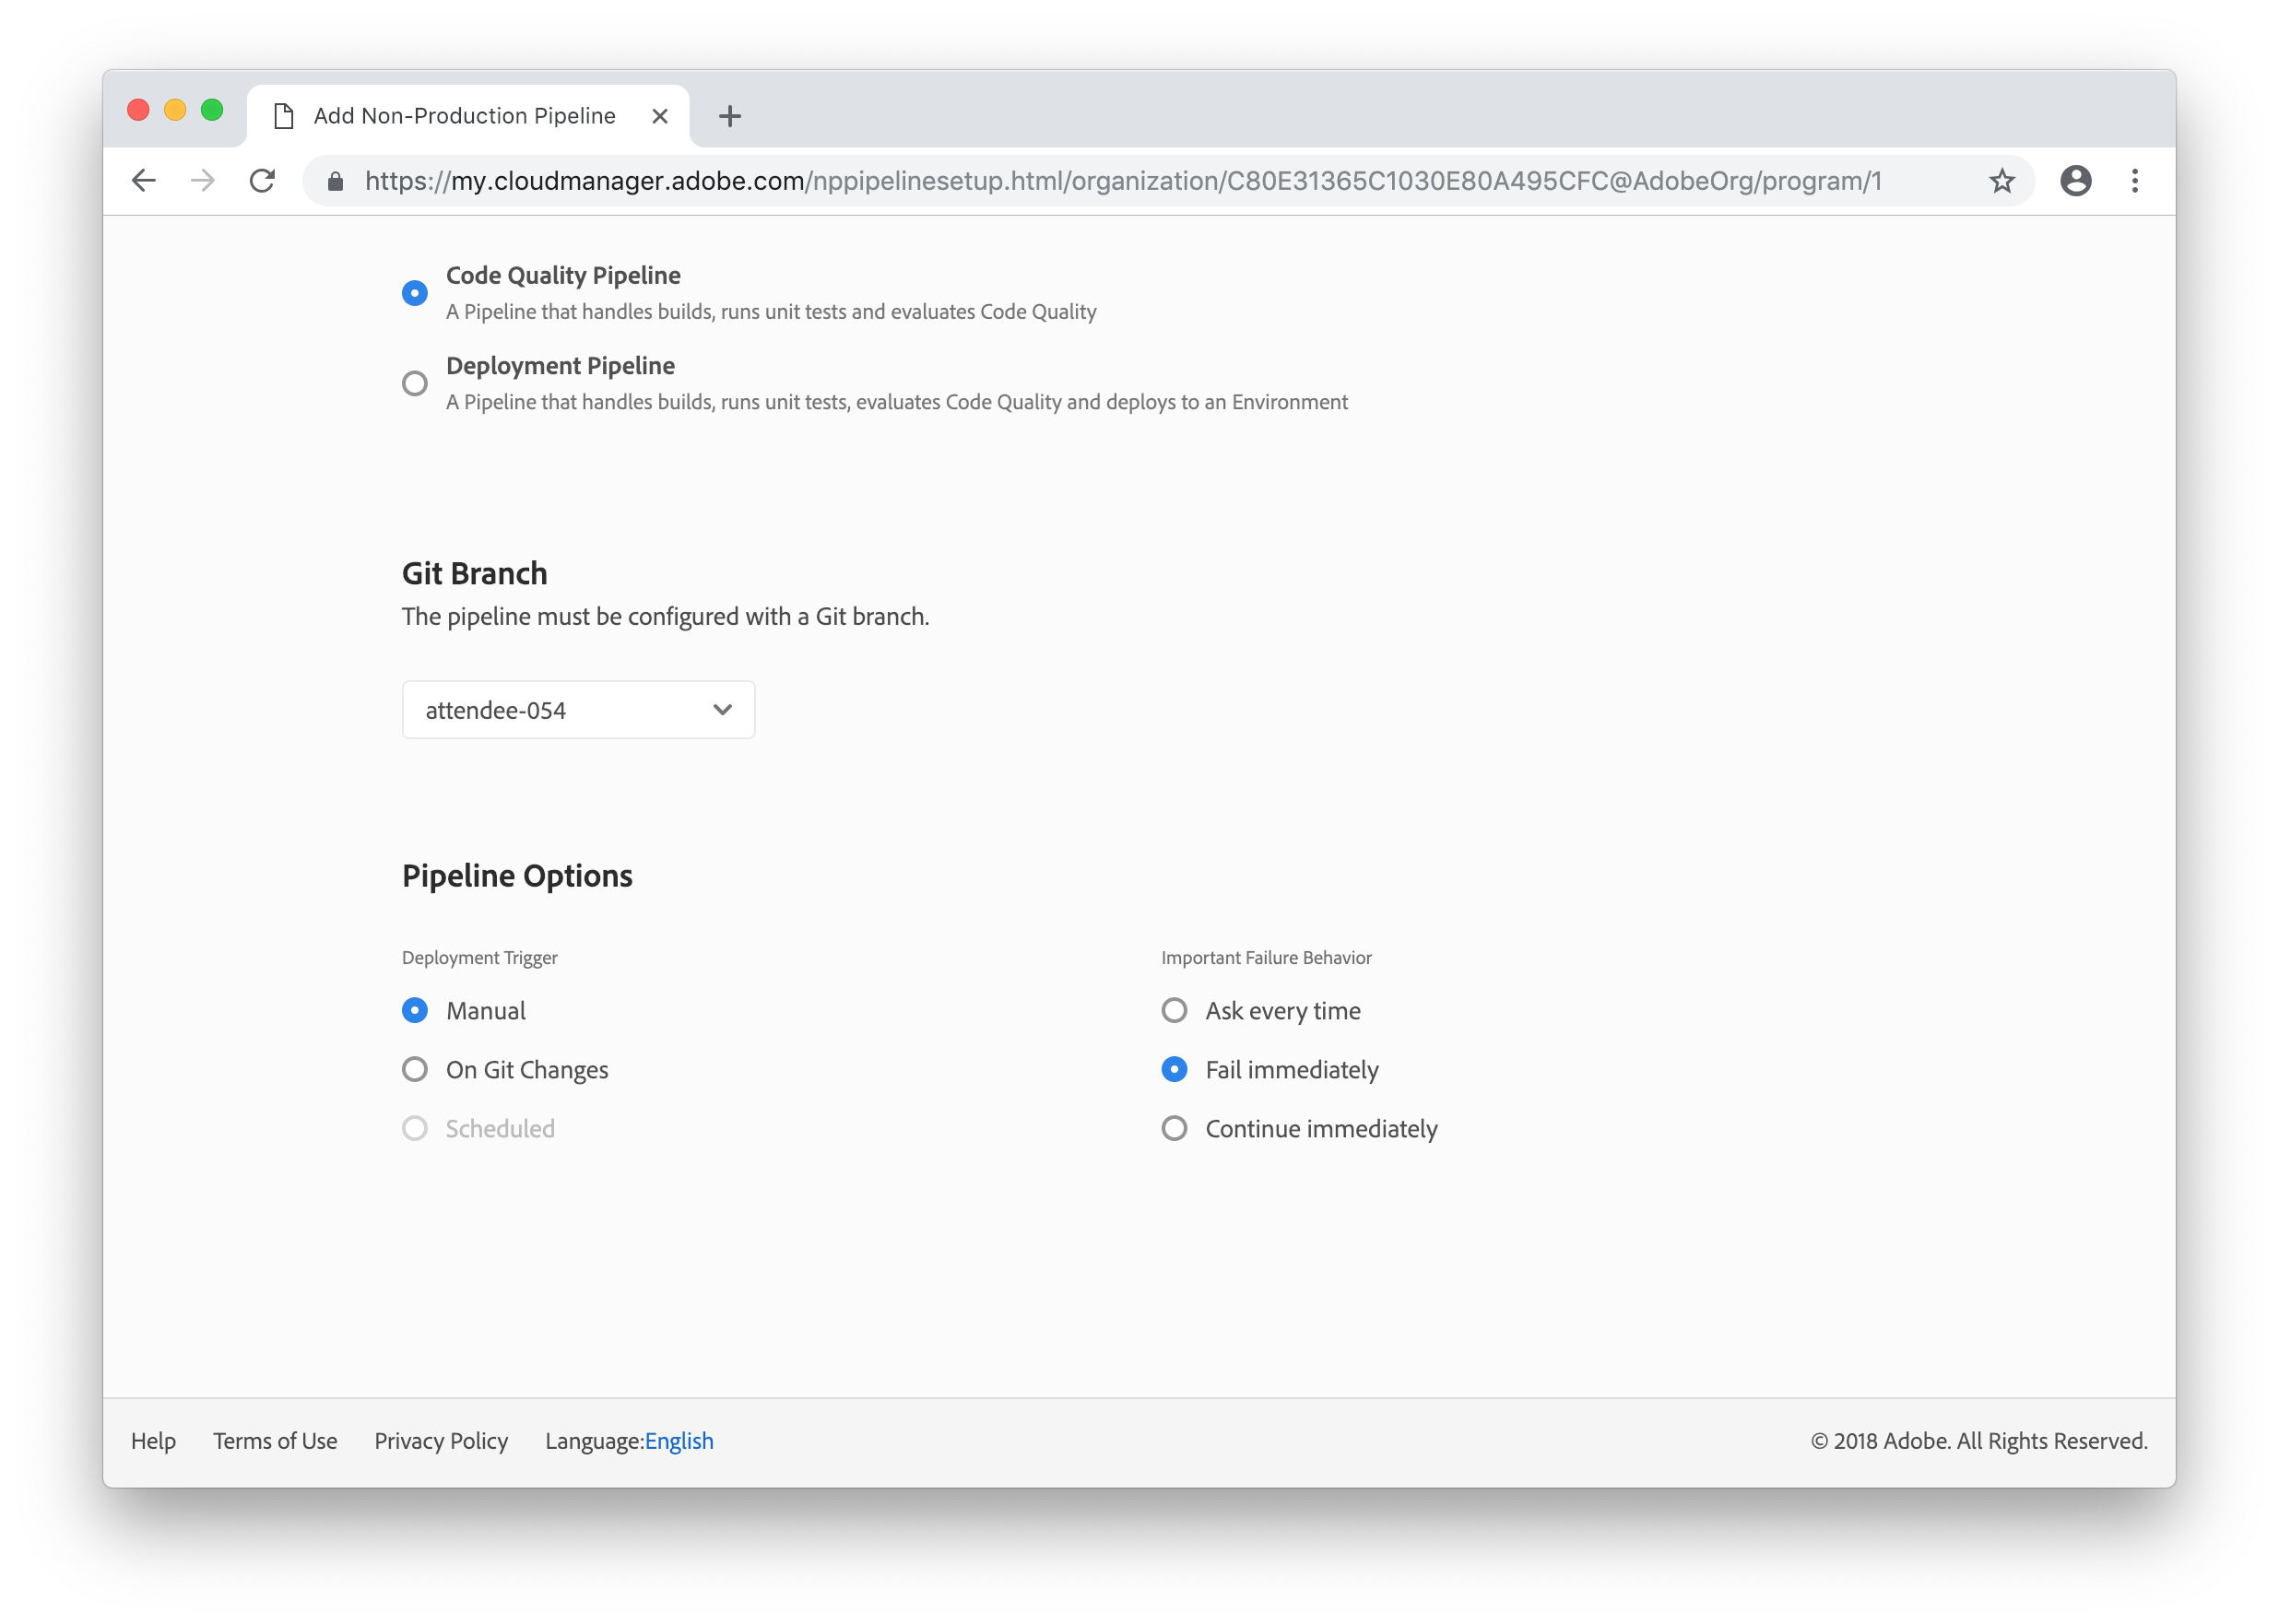
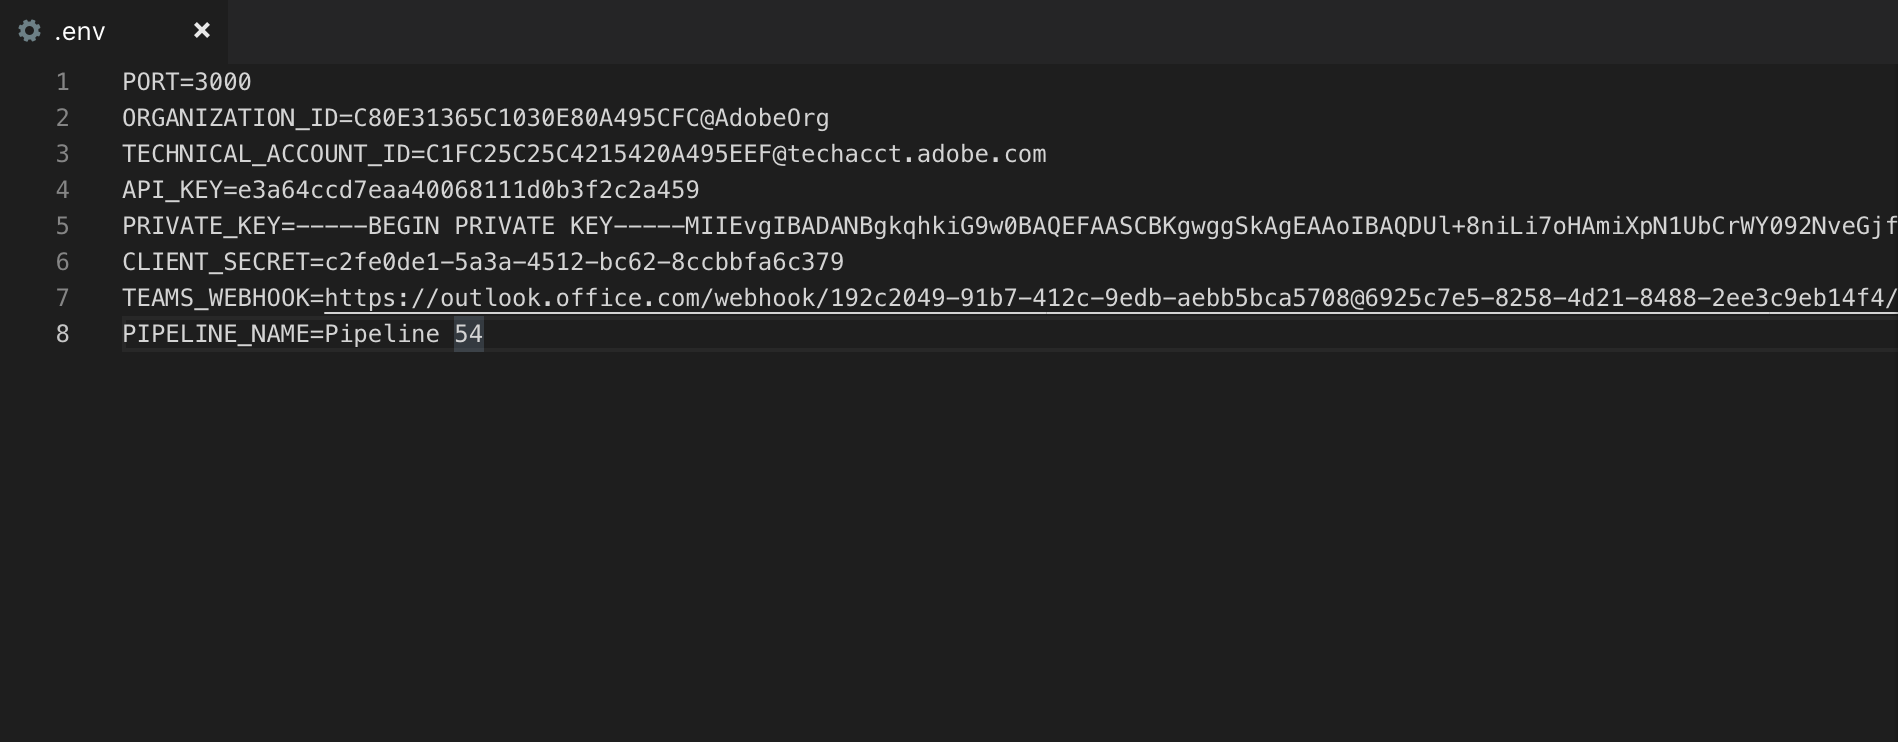
Provide a name for your pipeline which includes your attendee number. For example, if your attendee number is 5, name it Pipeline 5. Make sure that Code Quality Pipeline is the selected Pipeline Type (it should be the only option available).
The git repository for this program has been set up with 100 branches, one for each attendee. This is not really typical -- most programs only have a handful of branches. Select the branch which corresponds to your attendee number.
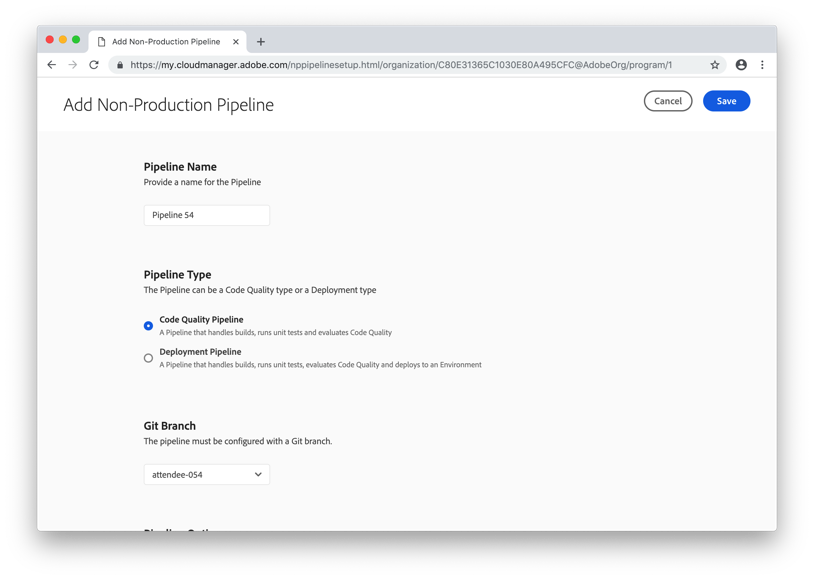
Finally, make sure that the Manual trigger is selected under the Pipeline Options section and that the Important Failure Behavior is set to Fail immediately.
Finally, click the Save button in the top right corner.
In this lesson, we will execute the pipeline created in the first lesson and observe the results in both summarized and detailed form.
Now that we have our pipeline setup, it is time to execute it.
You should be back on the Cloud Manager Overview page. If not, click the Overview link in the top navigation.
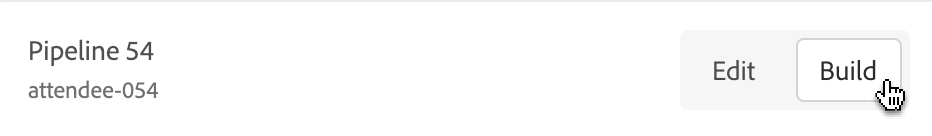
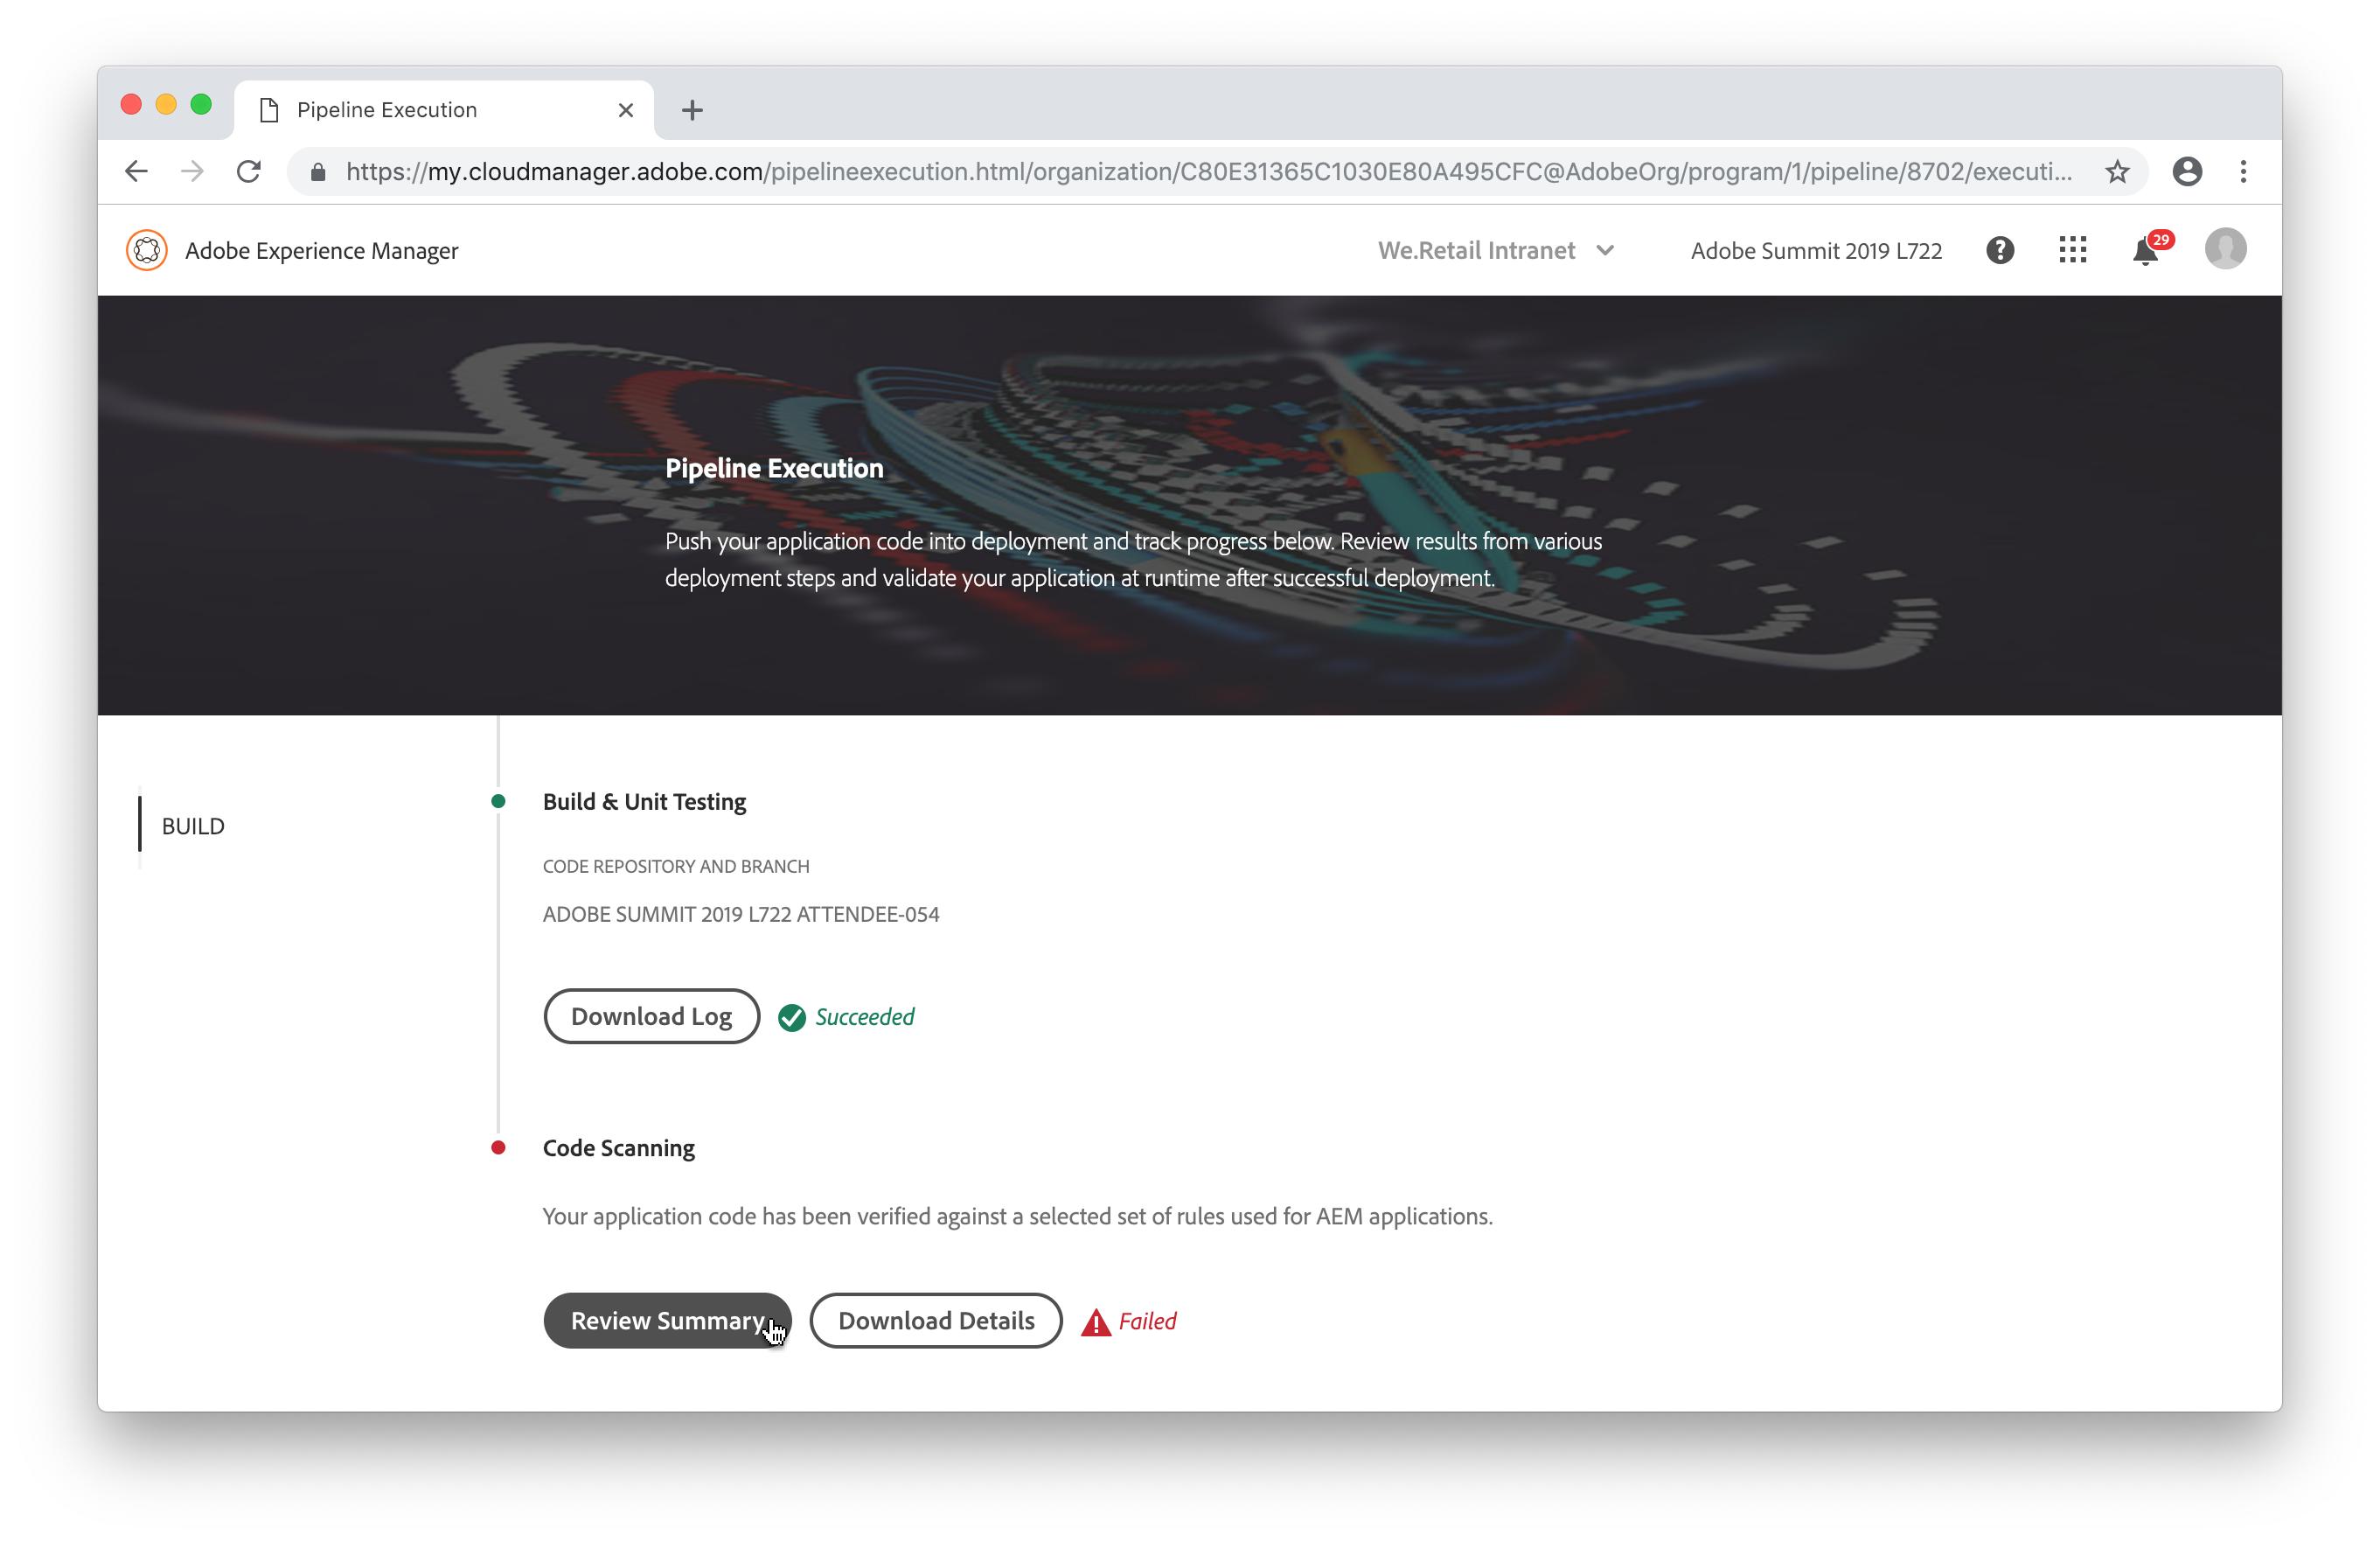
In the Non-Production Pipelines box, find the pipeline you created in the first step. Hover over the row in the table and click the Build button. This will take you to the Pipeline Execution page.
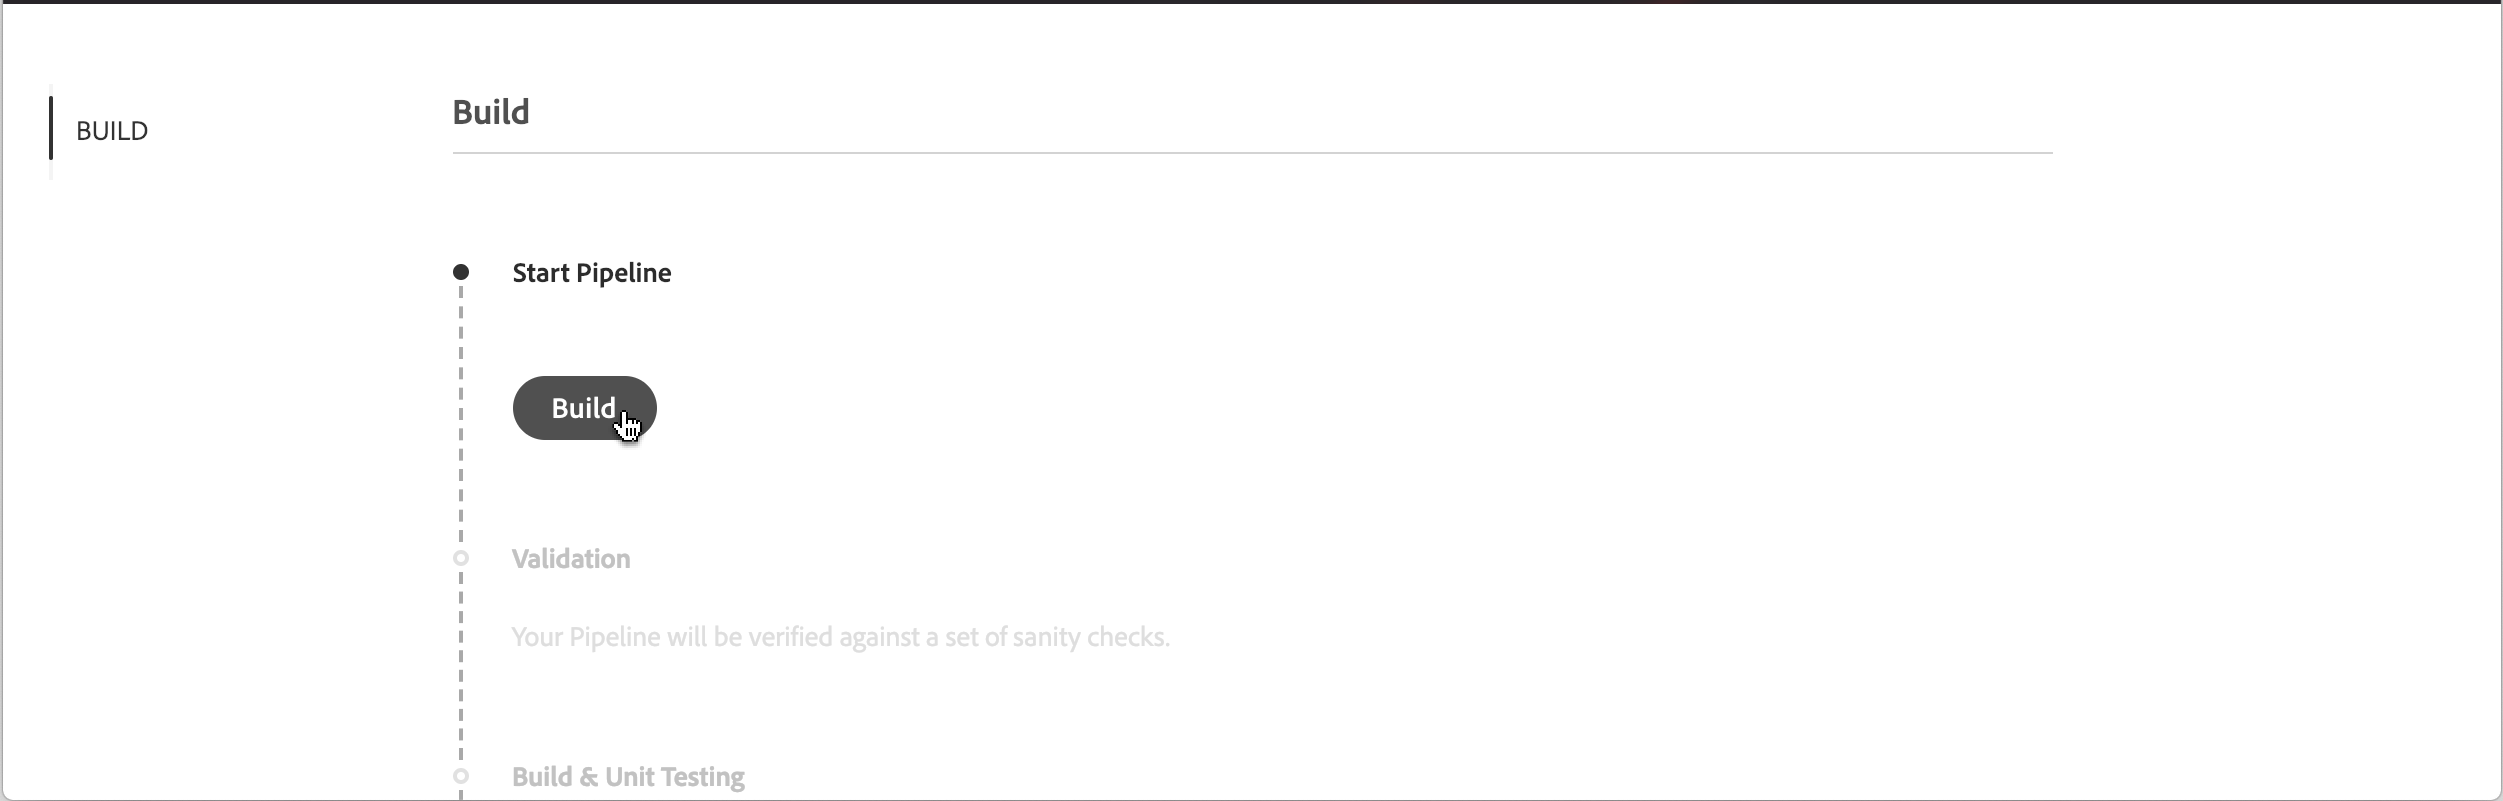
On the Pipeline Execution page, click the Build button to start the pipeline.
This will take a little time, so grab something to drink.
Uh oh. The pipeline failed. Let's see why. Looking at the execution details screen, you'll see that the Code Quality step has failed. Click on the Review Summary button to open the summary dialog.
The Code Quality, Security Testing, and Performance Testing steps in Cloud Manager all follow a three-tier structure -- the step produced a variety of metrics and these are classified as either Critical, Important, or Informational. If a Critical metric has not met its threshold, the execution fails immediately. If an Important metric has not met its threshold, the execution is paused (by default, although in this case, we specified the pipeline should fail immediately since it is a Code Quality-only pipeline) until someone overrides or rejects the violation. And Informational metrics are purely Informational.
The Security Test step is slightly different in that each "metric" is actually a separate Health Check and either passes or fails, but the same three-tier concept applies.
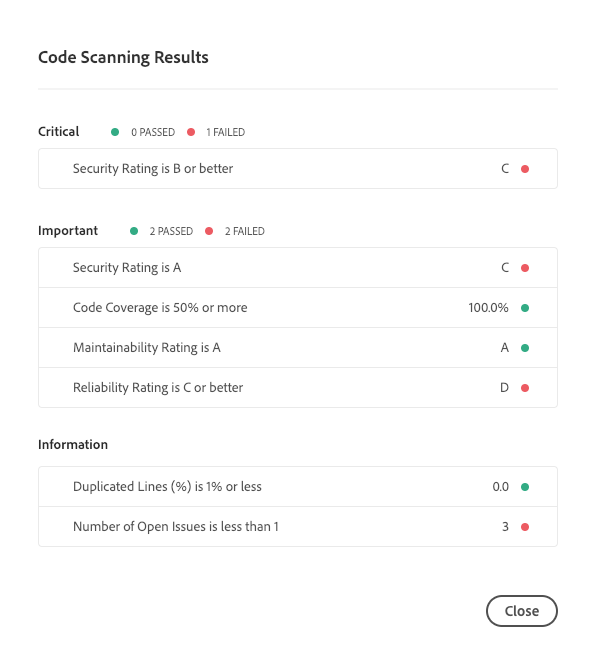
In this case, we actually have two problems -- the Security Rating is a C and the Reliability Rating is a D. The Reliability Rating is an Important metric, so we could override that, but the Security Rating is Critical so we must fix that in order to proceed. So let's do that. Click the Close button to dismiss the dialog.
Cloud Manager provides a spreadsheet listing the specific coding rule violations which led to the metrics. We'll need that for the next lesson, so click the Download Details button to download it.
The resulting download should open automatically in Microsoft Excel, but if not, go ahead and open it. There will be four rows in the spreadsheet -- a heading row and one row for each of the three violations identified in the project. You may want to adjust the columns for readability.
Building on the prior lesson, in this lesson you will download a copy of the codebase built by the Cloud Manager pipeline set up in the first lesson and executed in the second lesson and attempt to resolve the problems identified during the pipeline execution.
Now that Cloud Manager has told us where the problems in our code lie, let's go ahead and fix them. To do this, you will clone the Cloud Manager-provided git repository for this program and make your changes on your branch.
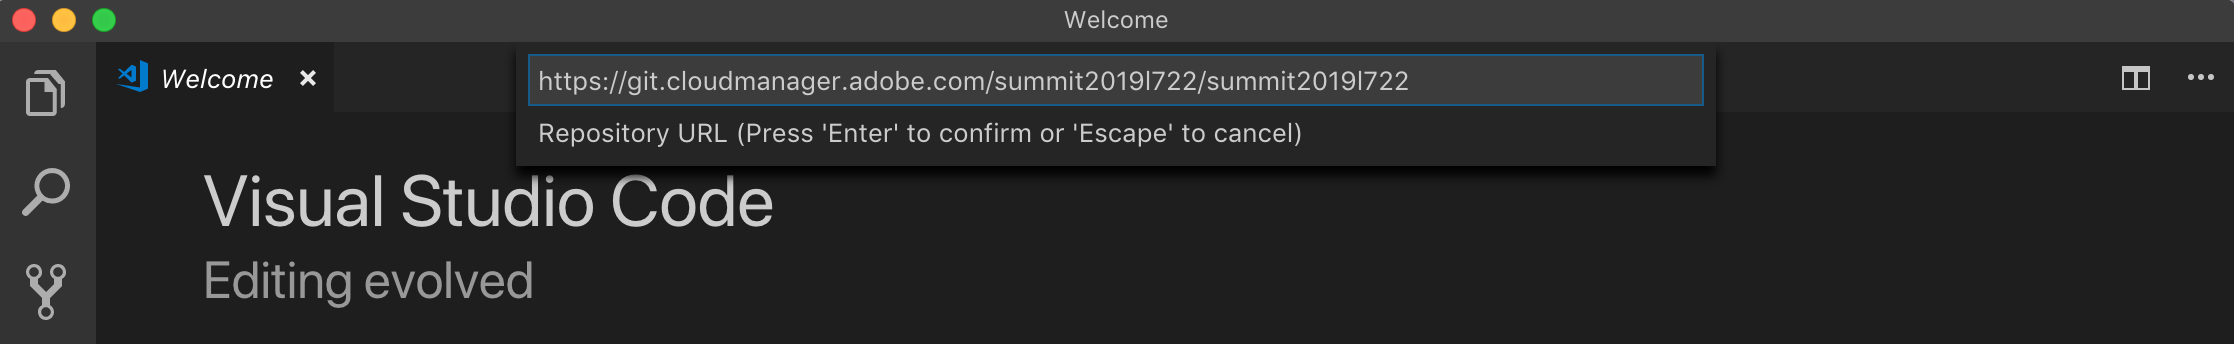
In order to connect to the git repository, you will need a URL, username, and password. These can be found in a file named git_credentials.txt on the Desktop. Open this file in TextEdit.
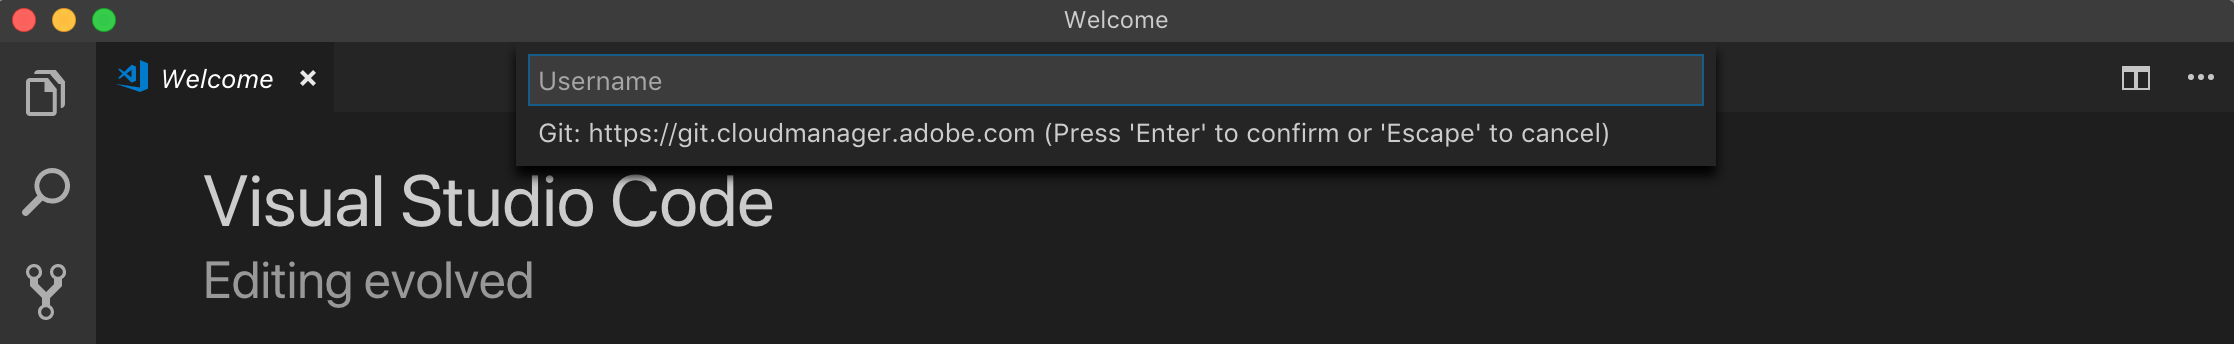
In this lab, we will be using Microsoft Visual Studio Code as our Integrated Development Environment, but if you are doing this lab on your own, you can use any IDE. To start, open Visual Studio Code. Select Command Palette from the View menu and type Git: Clone. Copy and paste the URL from the text file and press Enter.
When prompted, select your Documents folder and click Select Repository Location. Visual Studio Code will automatically create a folder inside the selected folder.
Visual Studio Code will now prompt you for the username and password. As with the URL, copy and paste these values from the text file and press Enter.
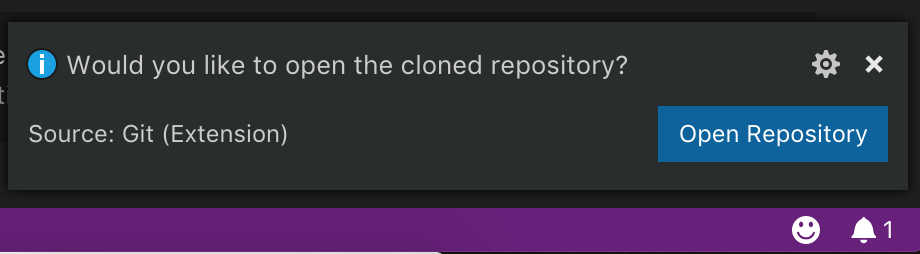
Once the clone operation is complete, Visual Studio Code will prompt you to open the cloned repository. Click the Open Repository button.
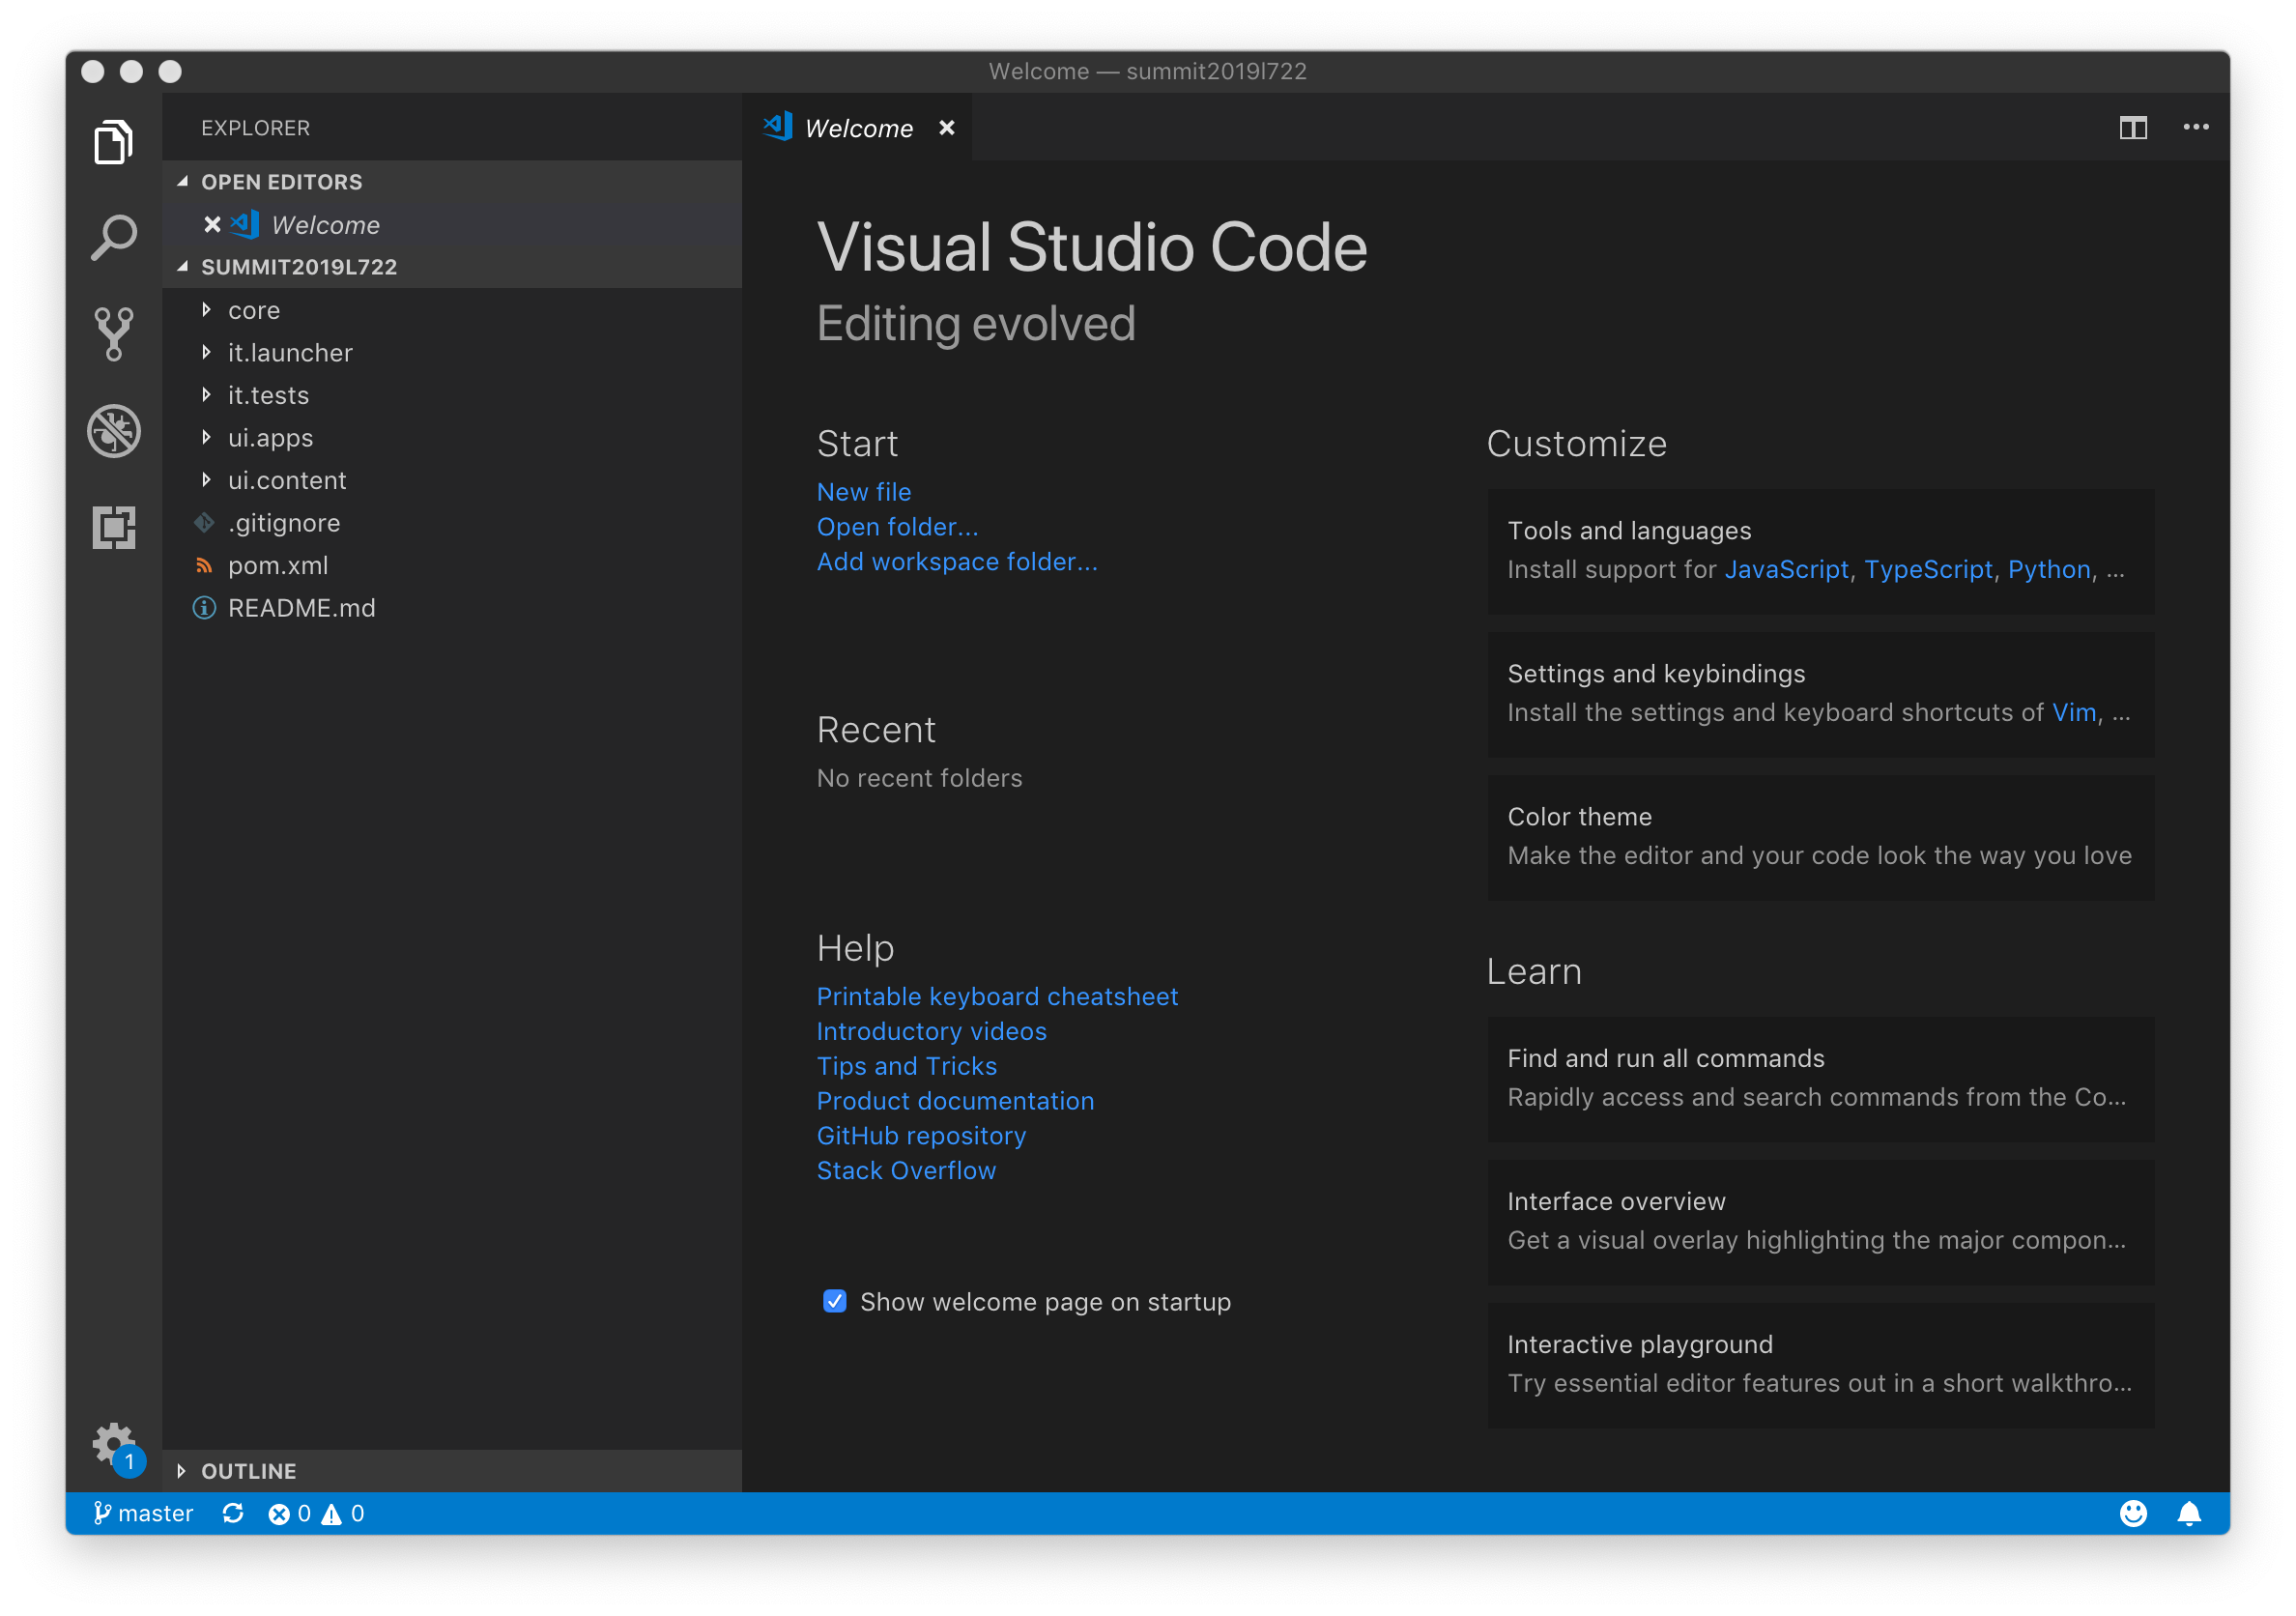
Your Visual Studio Code window should now look like this:
The last thing you need to do before editing code is to checkout your specific branch. As mentioned in Exercise 1.2, each attendee has their own branch. To checkout your branch, open the Command Palette and select Git: Checkout to....
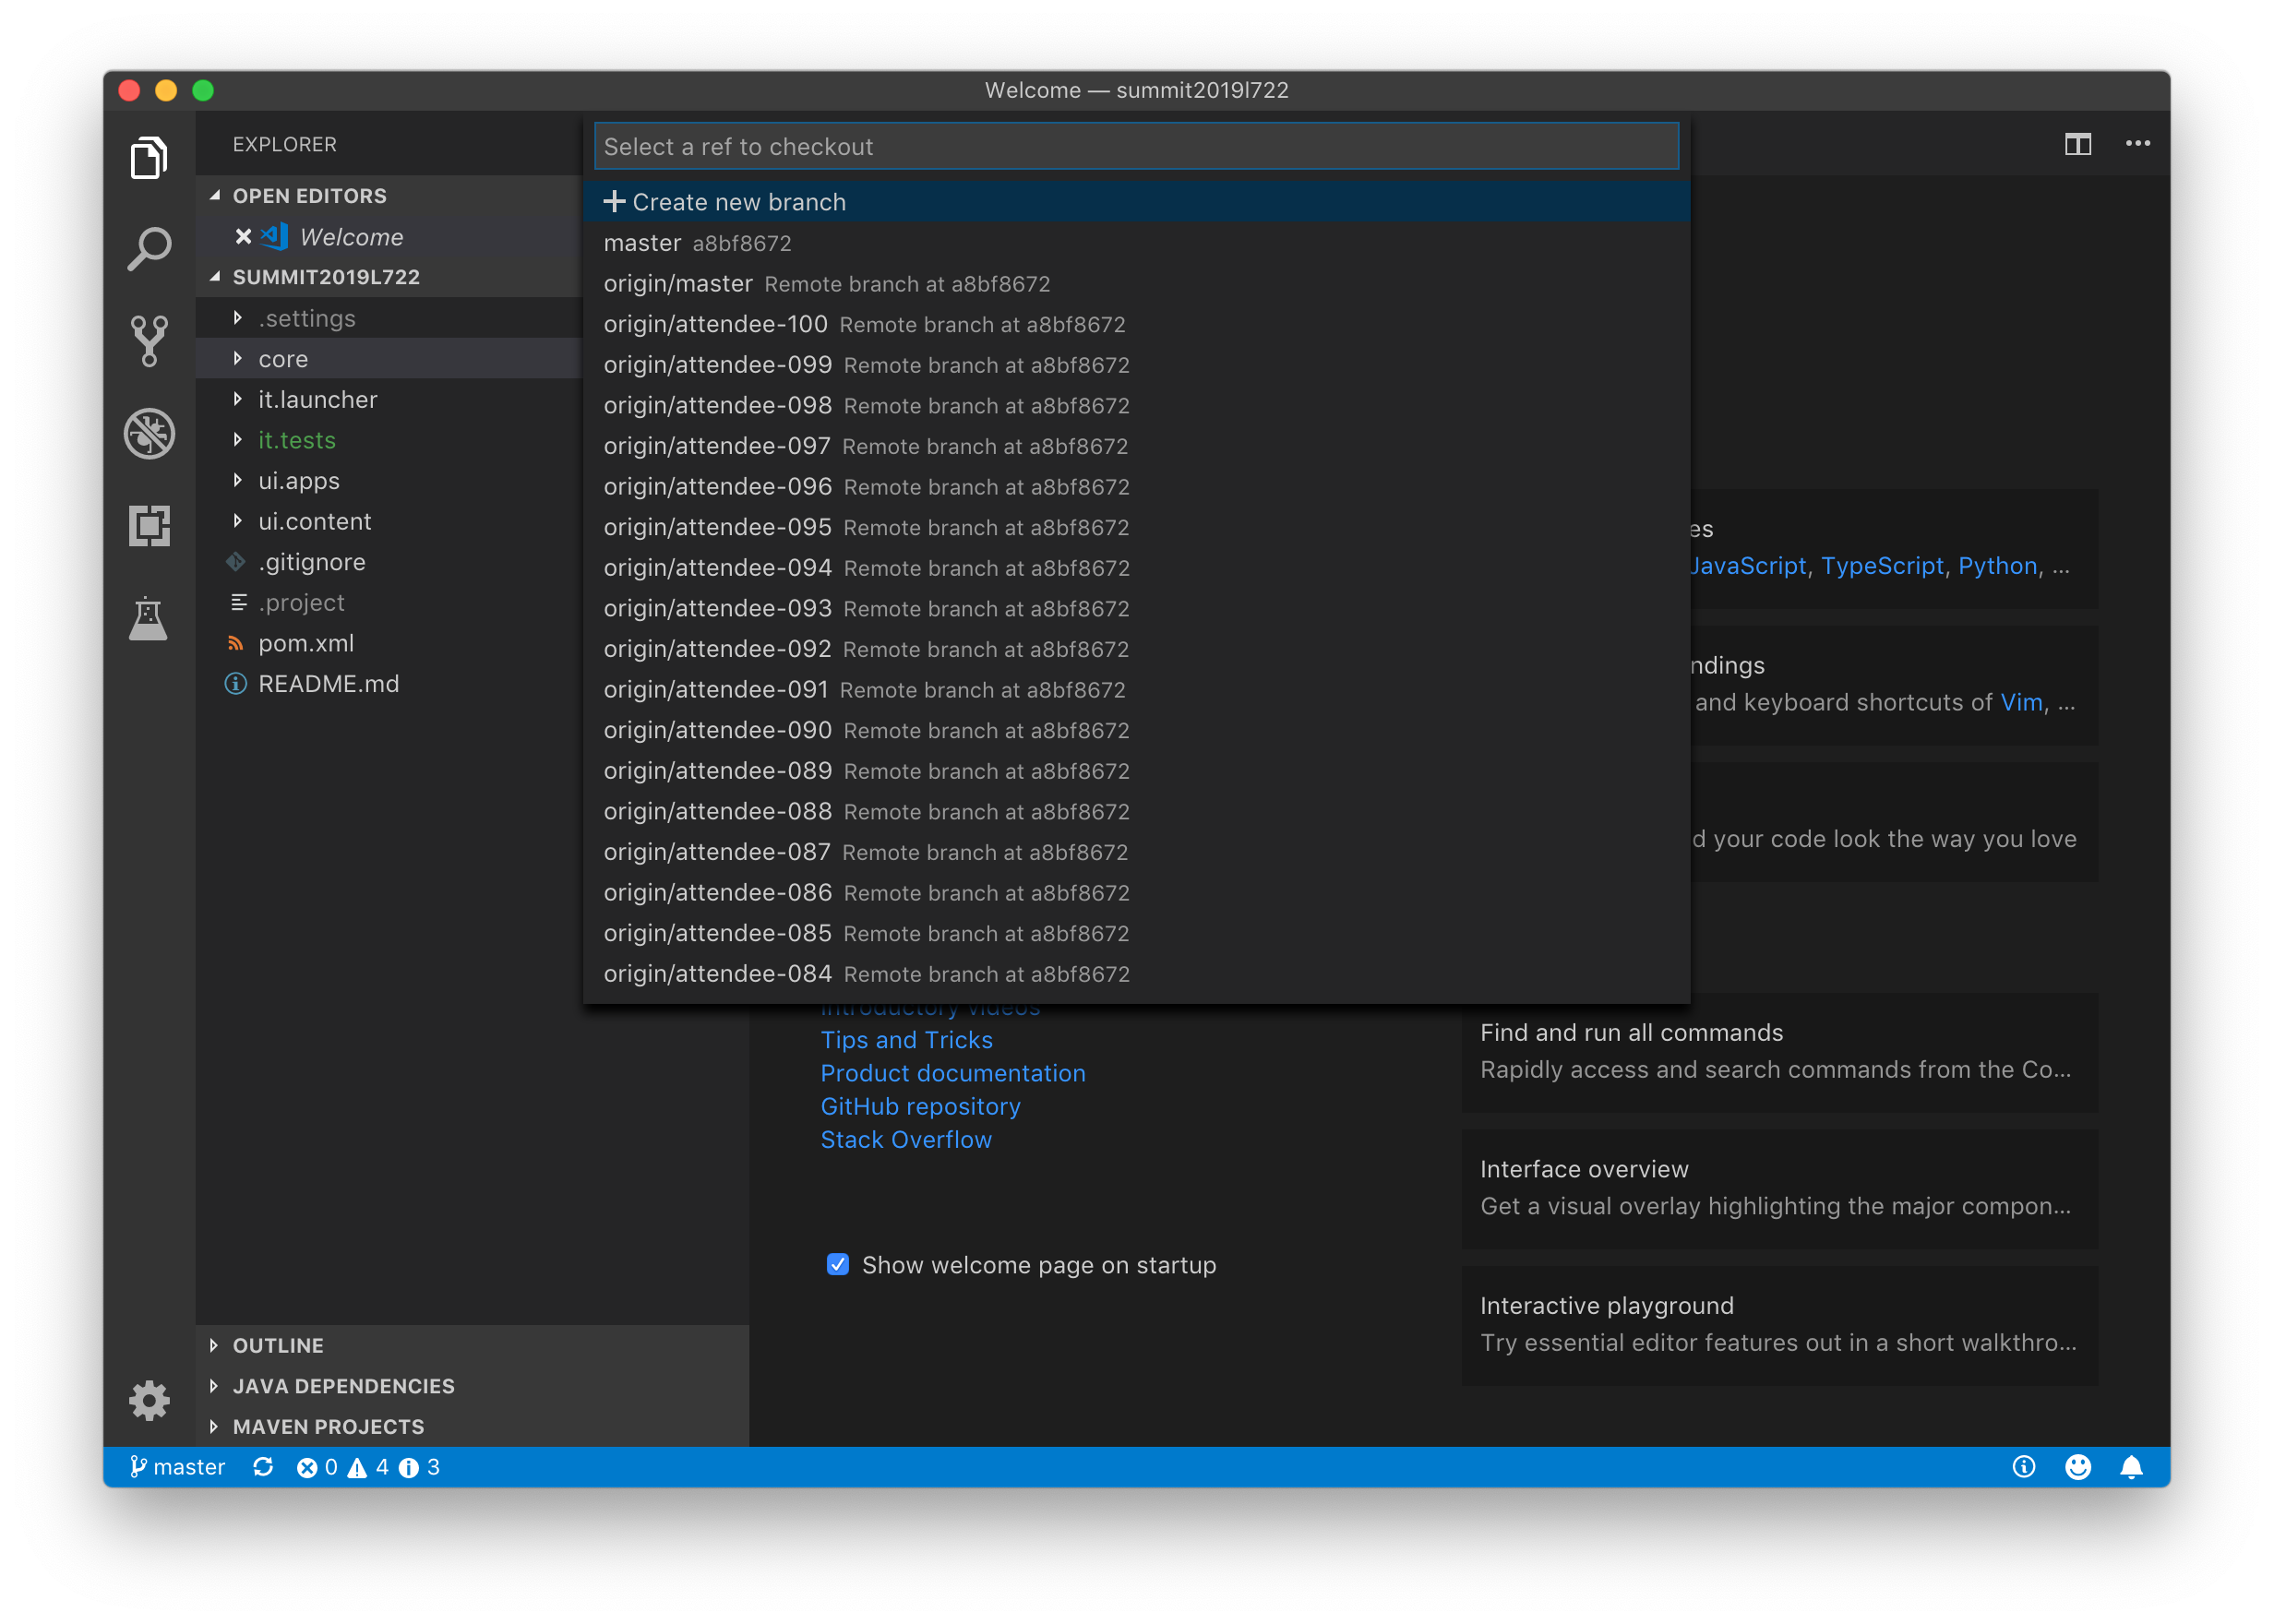
Select your branch and press Enter.
In Visual Studio Code, the current branch is shown in the bottom left-hand corner. Confirm that the proper branch has been selected.
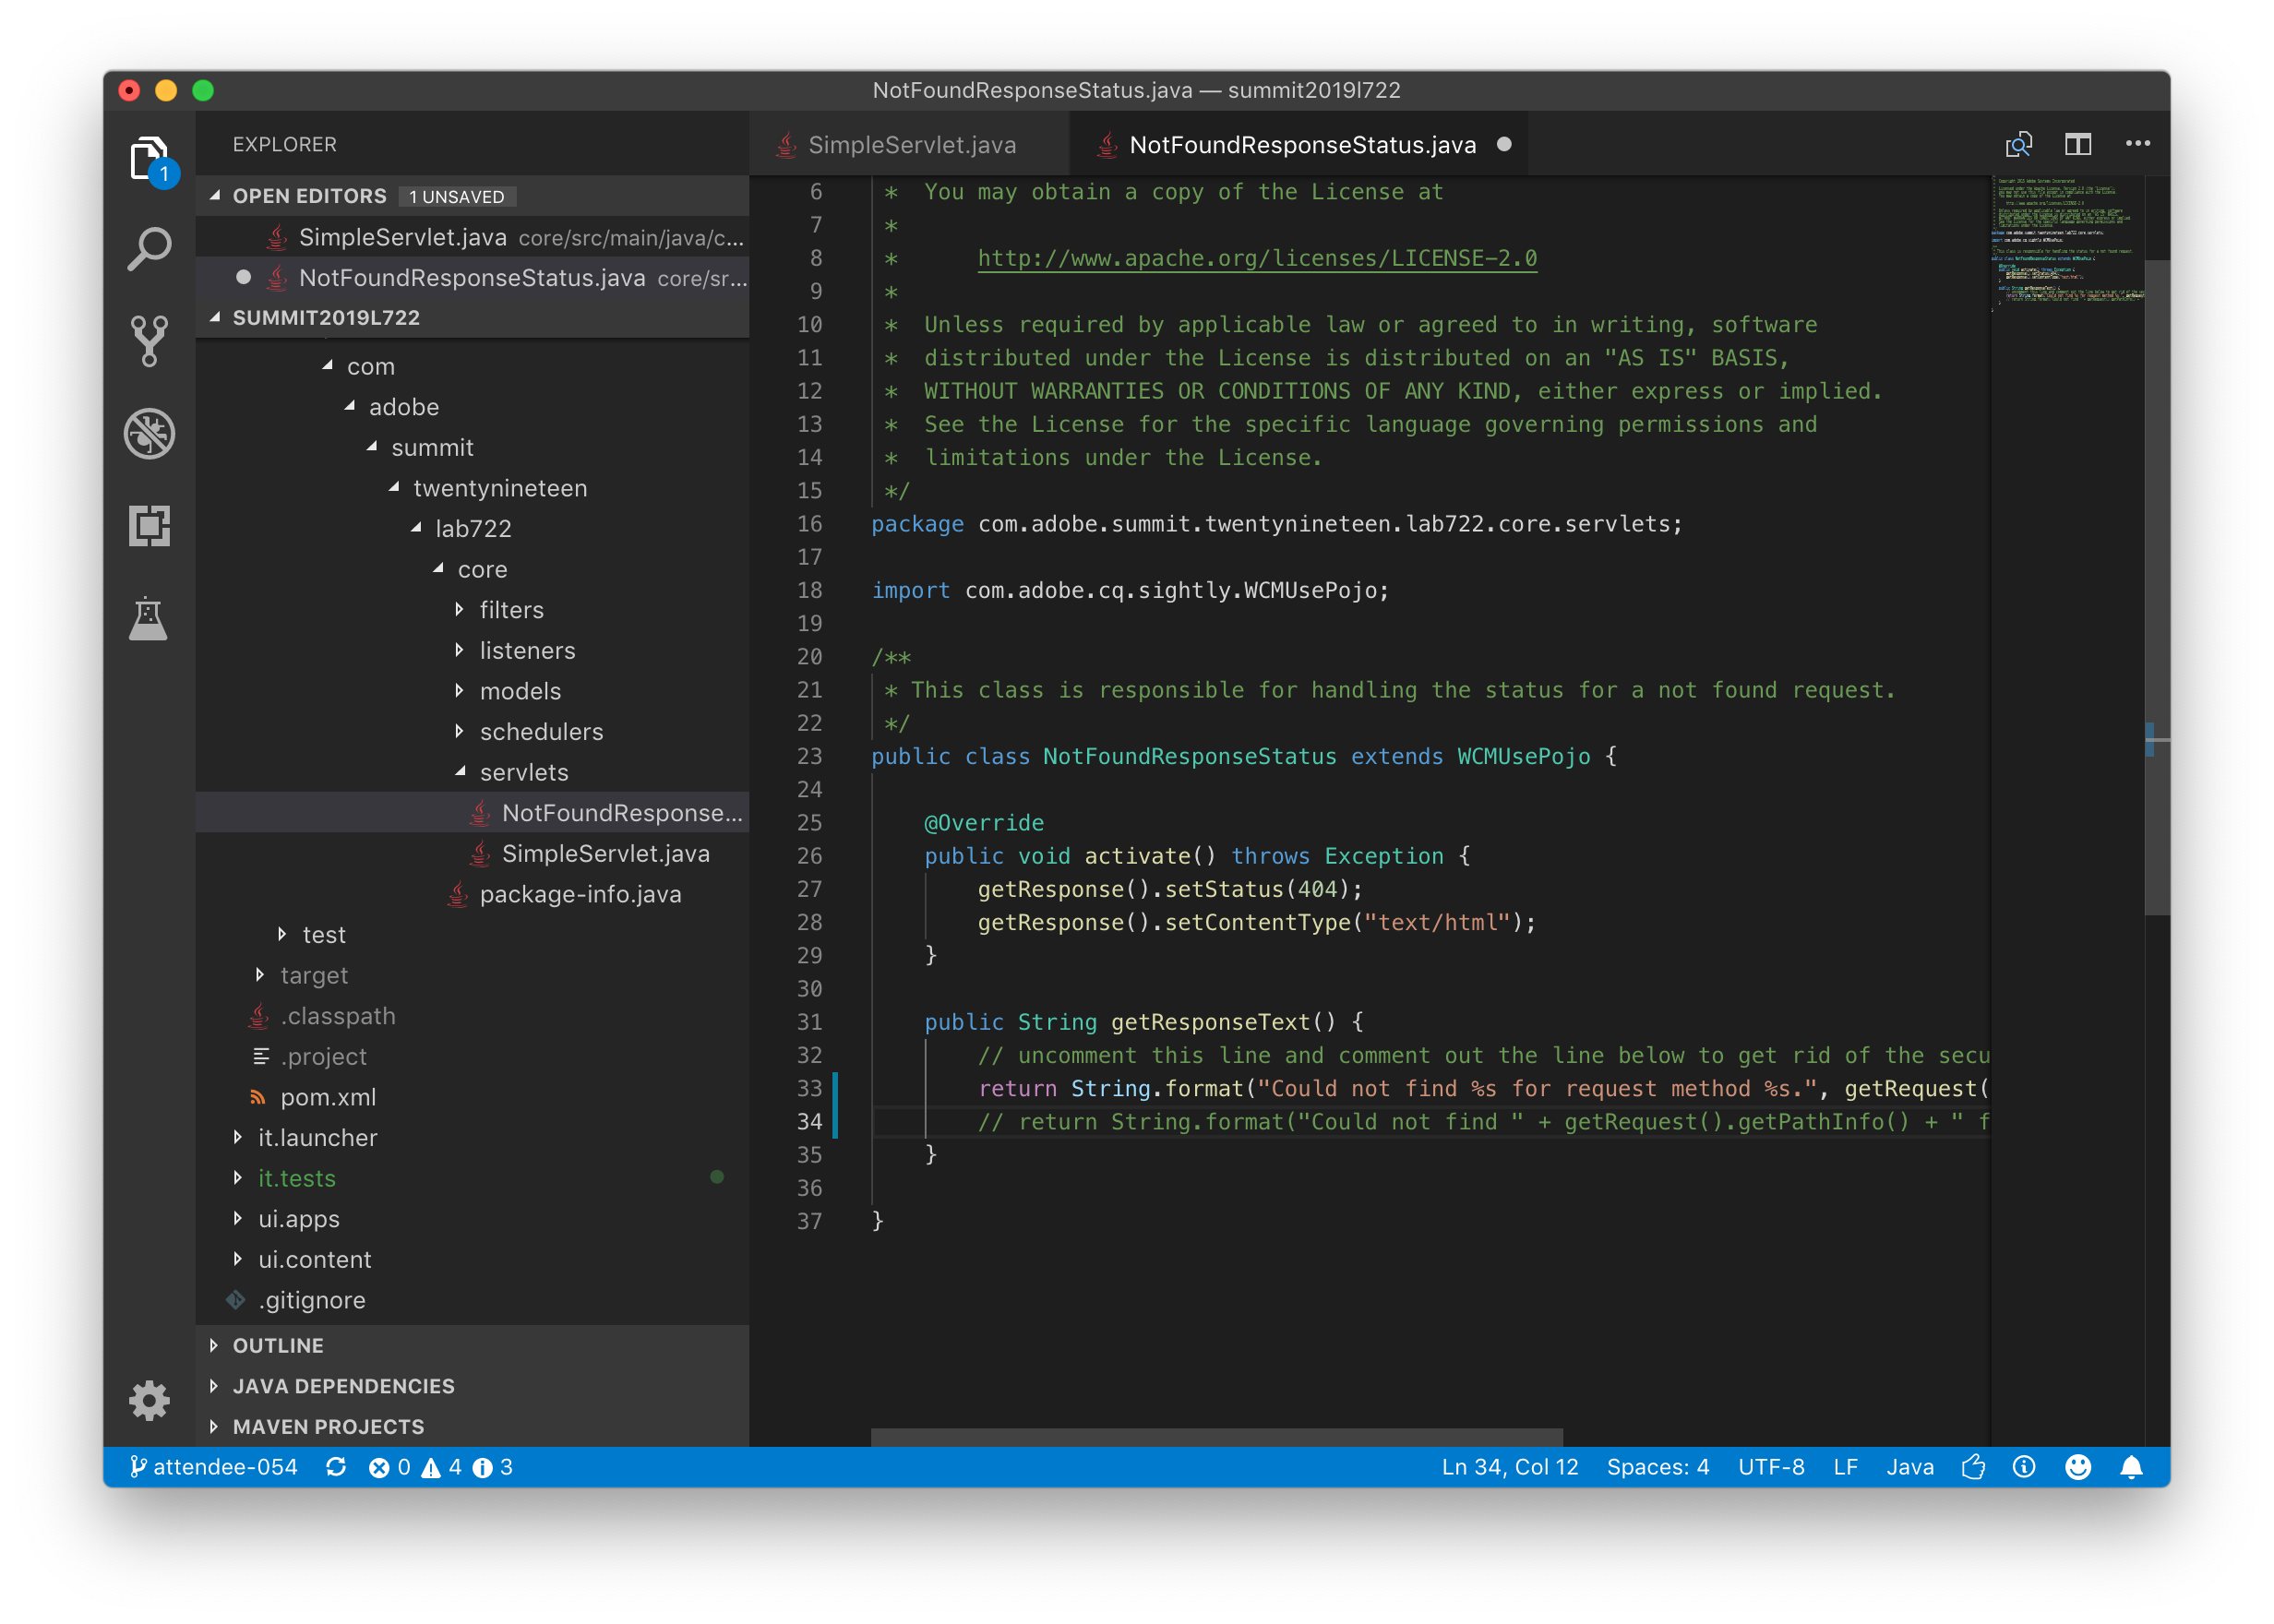
Now that the code is checked out, the two issues identified by Cloud Manager can be fixed. Based on the spreadsheet, you can see that the issues are in the files named NotFoundResponseStatus.java and SimpleServlet.java.
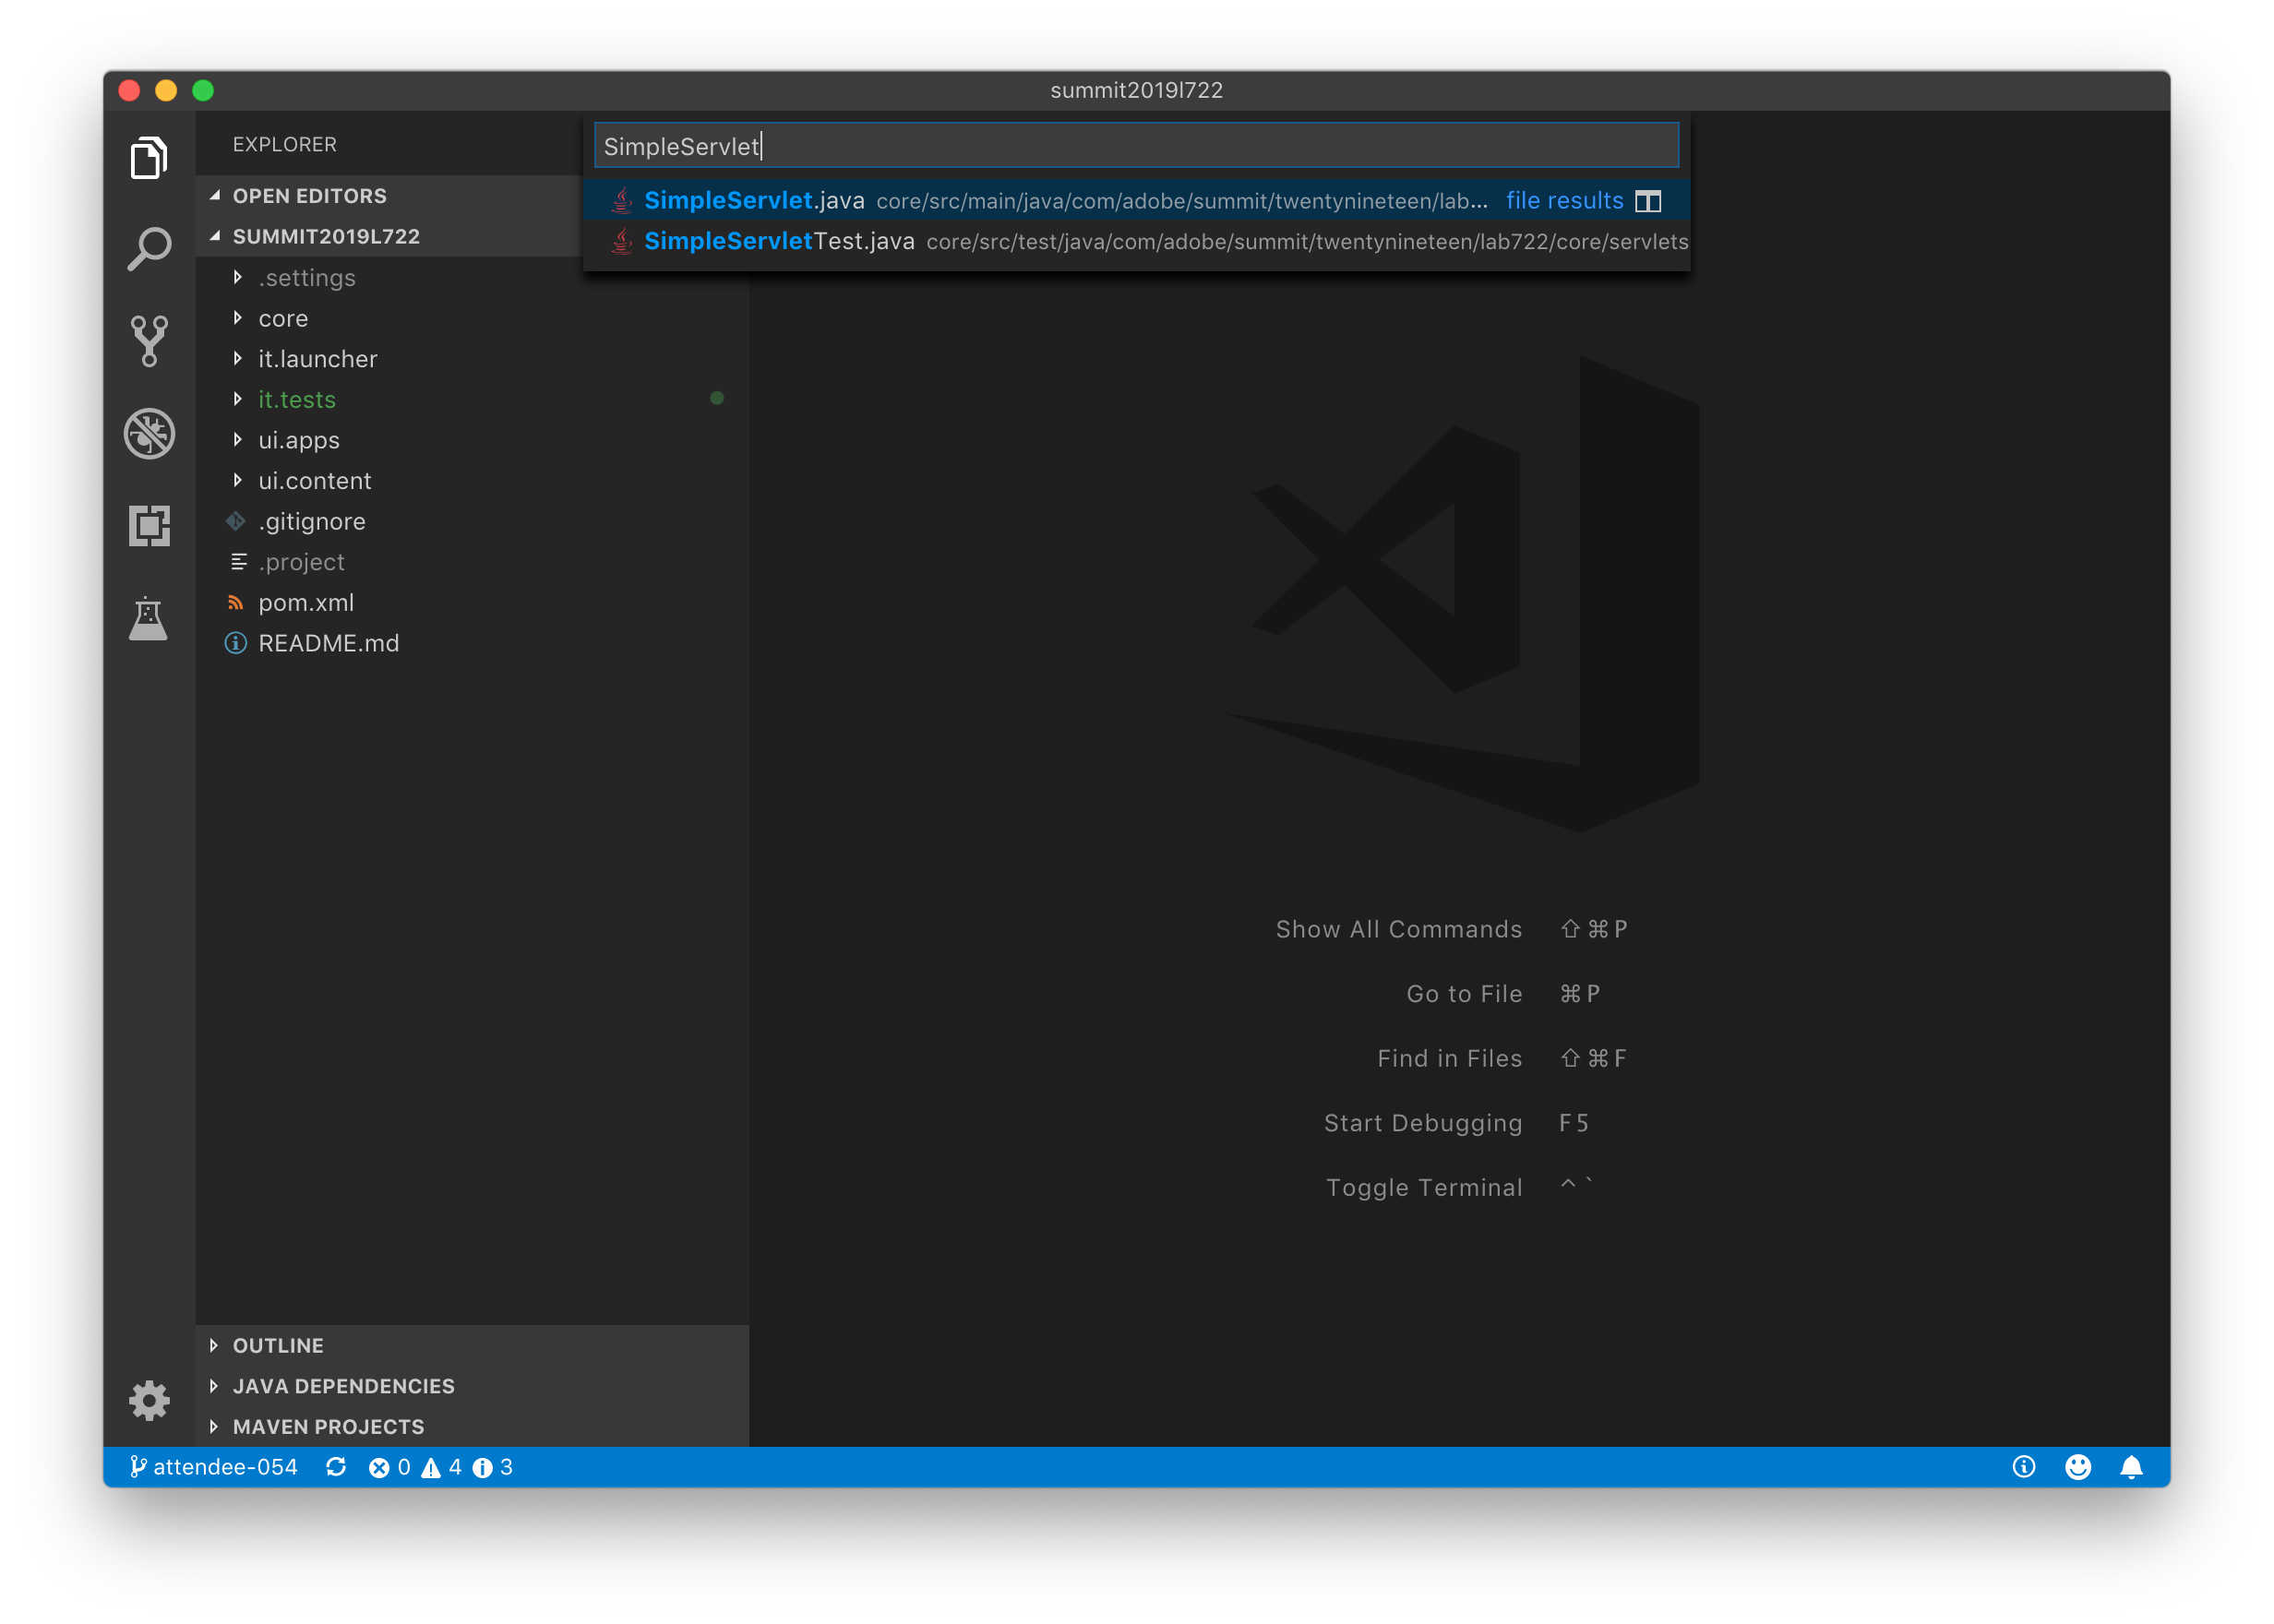
To easily open these files, open the Go menu and select Go to File.... Then enter the file name.
For both files, the fixes are in the source file, just commented out. Follow the inline instructions as to which lines to add comments to and which lines to uncomment. After making the directed changes, NotFoundResponseStatus.java should look like this:
And SimpleServlet.java should look like this:
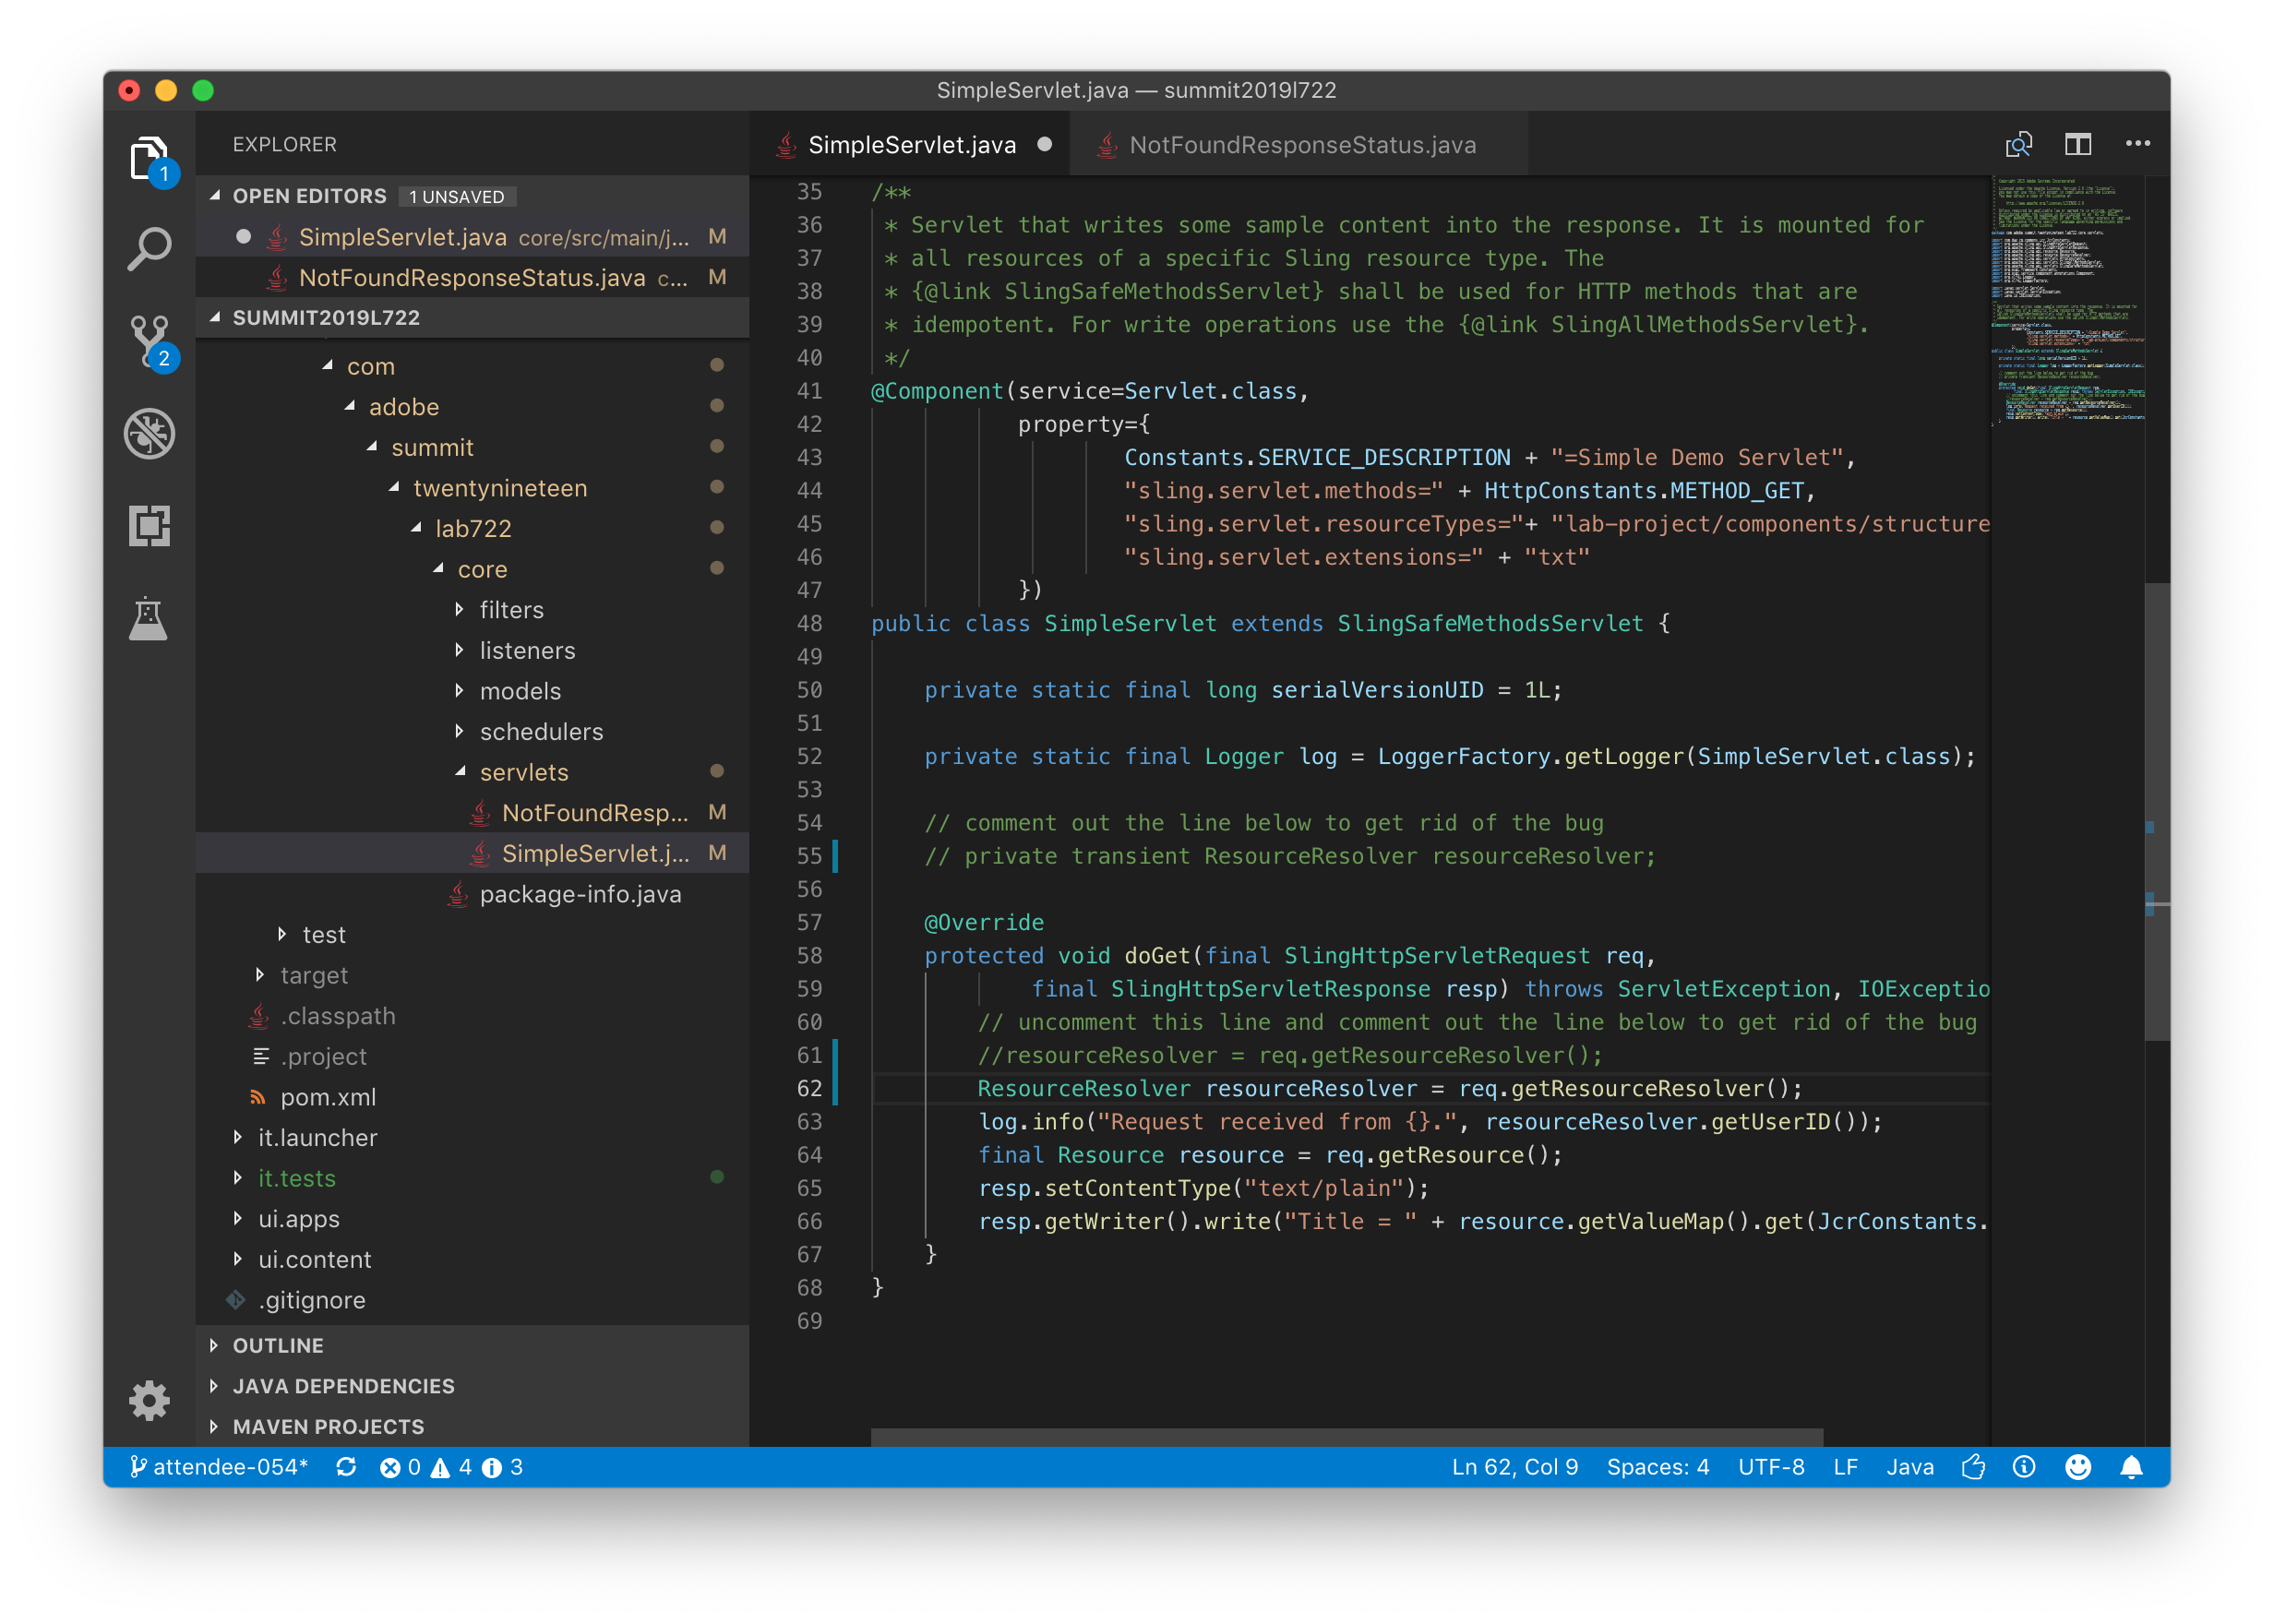
Remember to save both files.
These changes now need to be committed to the git repository. Open the Command Palette and select Git: Commit All. You'll be prompted to first stage your changes. Click the Yes button.
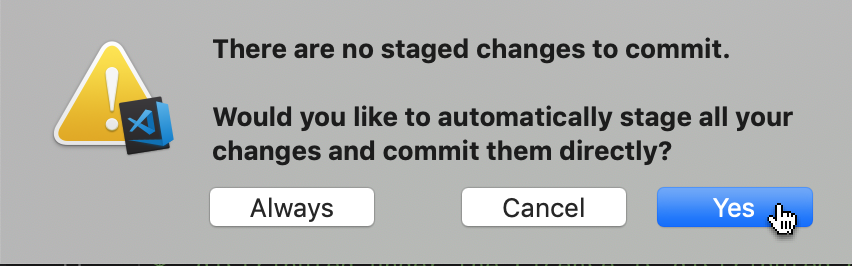
You'll then be prompted for a commit message. Type some useful message and press Enter.
Finally, to push this commit to the Cloud Manager git repository, open the Command Palette again and select Git: Push.
With the fixes to the issues committed and pushed, the pipeline should successfully execute. To try this, go back to the web browser, navigate to the Cloud Manager Overview page, find your pipeline and build it again.
In this lesson, you will run a simple web application which illustrates the type of application typically run to receive events from Adobe I/O. You will also use a tool called ngrok to expose that application to the public internet.
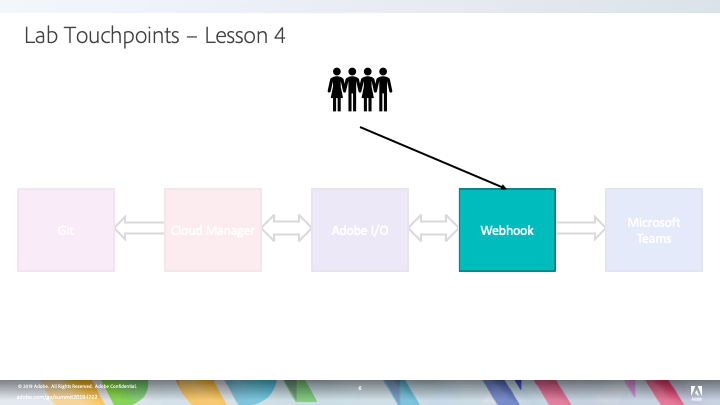
The next two lessons are focused on how to use the Cloud Manager API and Adobe I/O to receive notifications from Cloud Manager when the pipeline starts. To do this, we will create a webhook. A webhook is simply a small web application which receives a request from a service when something has happened. In this case, Adobe I/O will invoke the webhook on any pipeline event -- when the pipeline starts, when it ends, when individual steps start and end, etc.
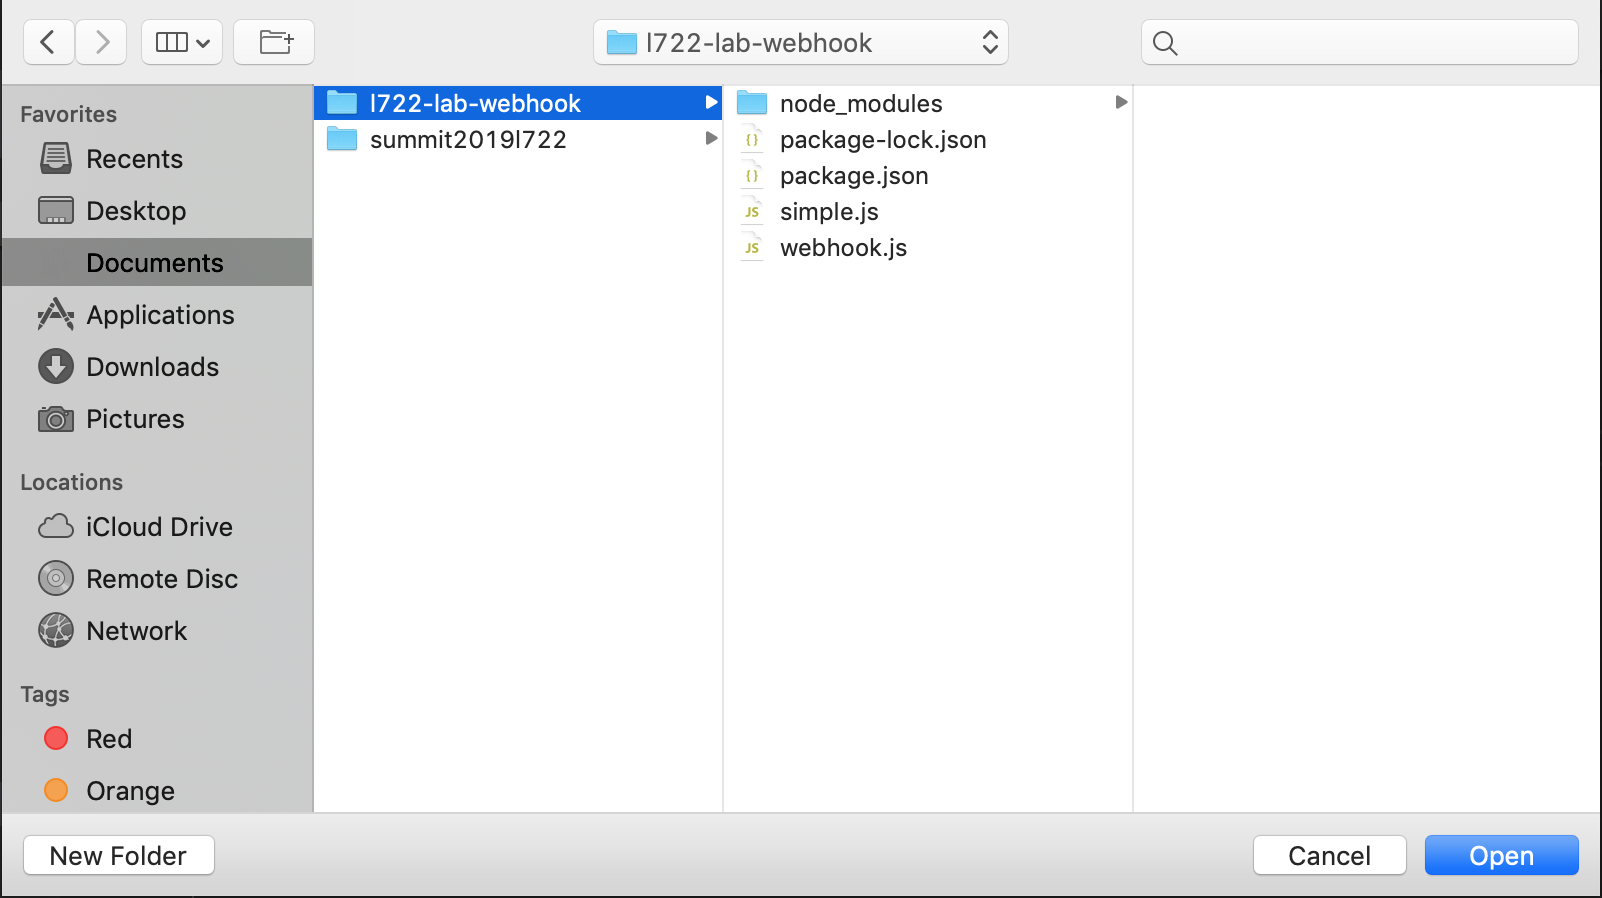
The bulk of the webhook has already been written and in the next lesson we will be configuring the webhook, but before we get to the real webhook implementation, let's start by running a very simple webhook. To start this, go back to Visual Studio Code. Open the File menu and select Open.... Click on Documents and select the l722-lab-webhook folder. Click the Open button.
The webhook project is available in a public GitHub repository. See the Additional Resources section for the link.
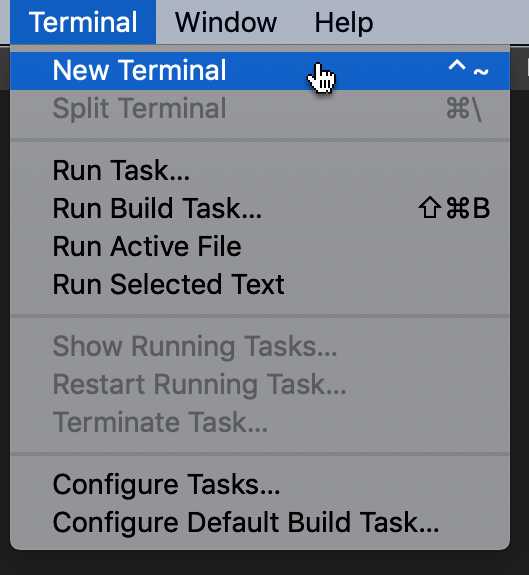
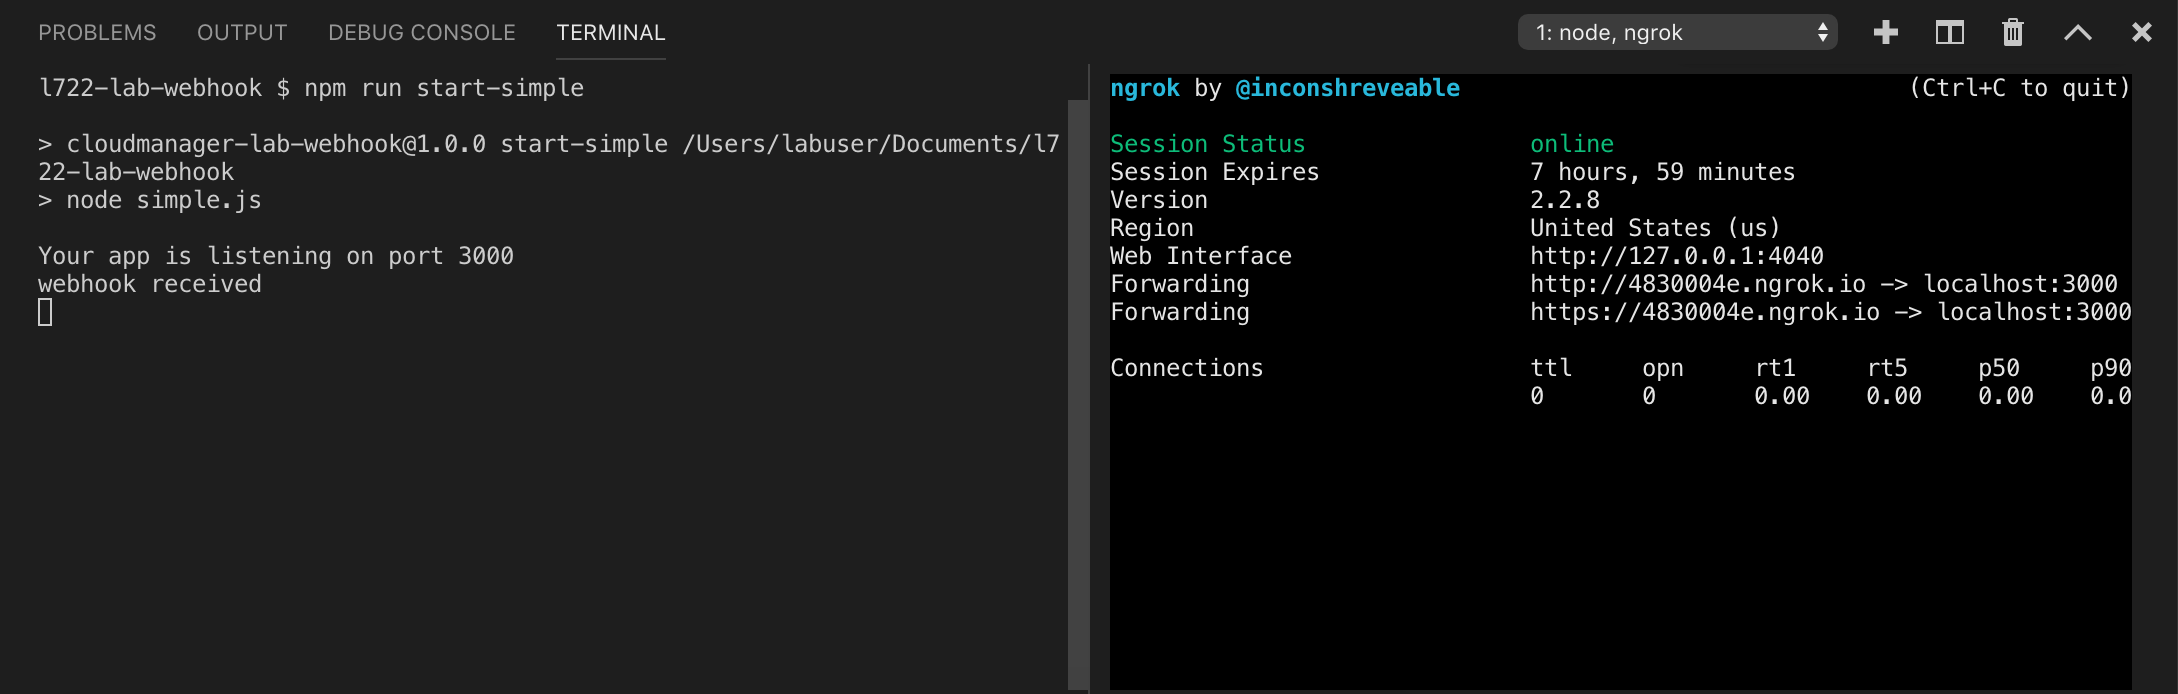
This folder contains two webhook implementations written in JavaScript -- simple.js and webhook.js. We're going to run simple.js script first. To do this, open the Terminal menu and select New Terminal.
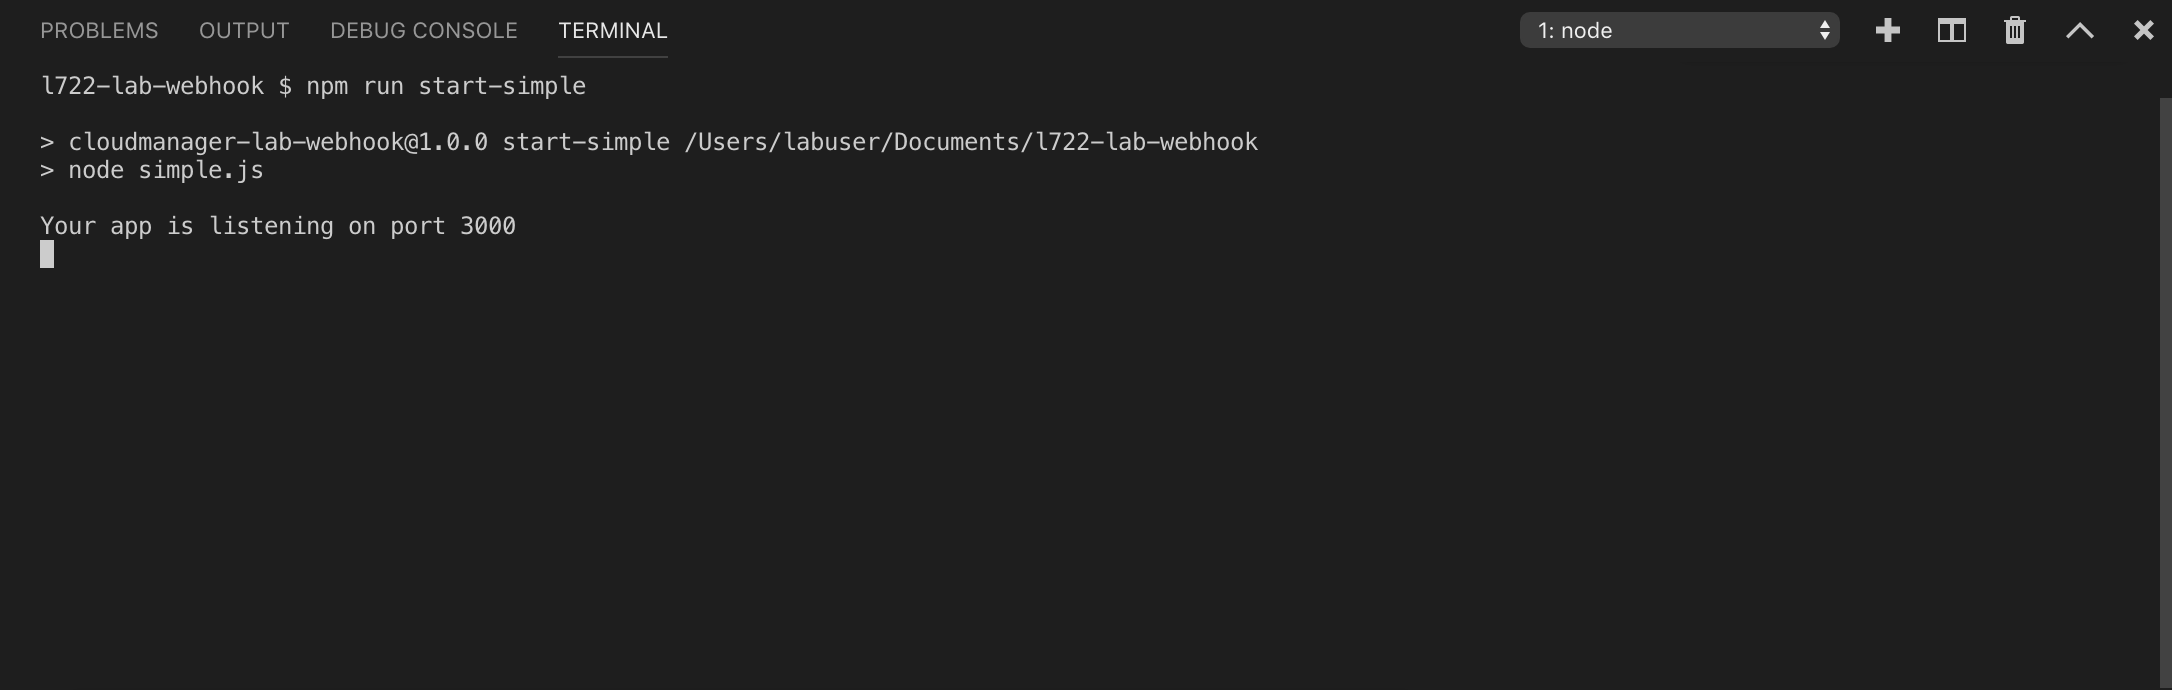
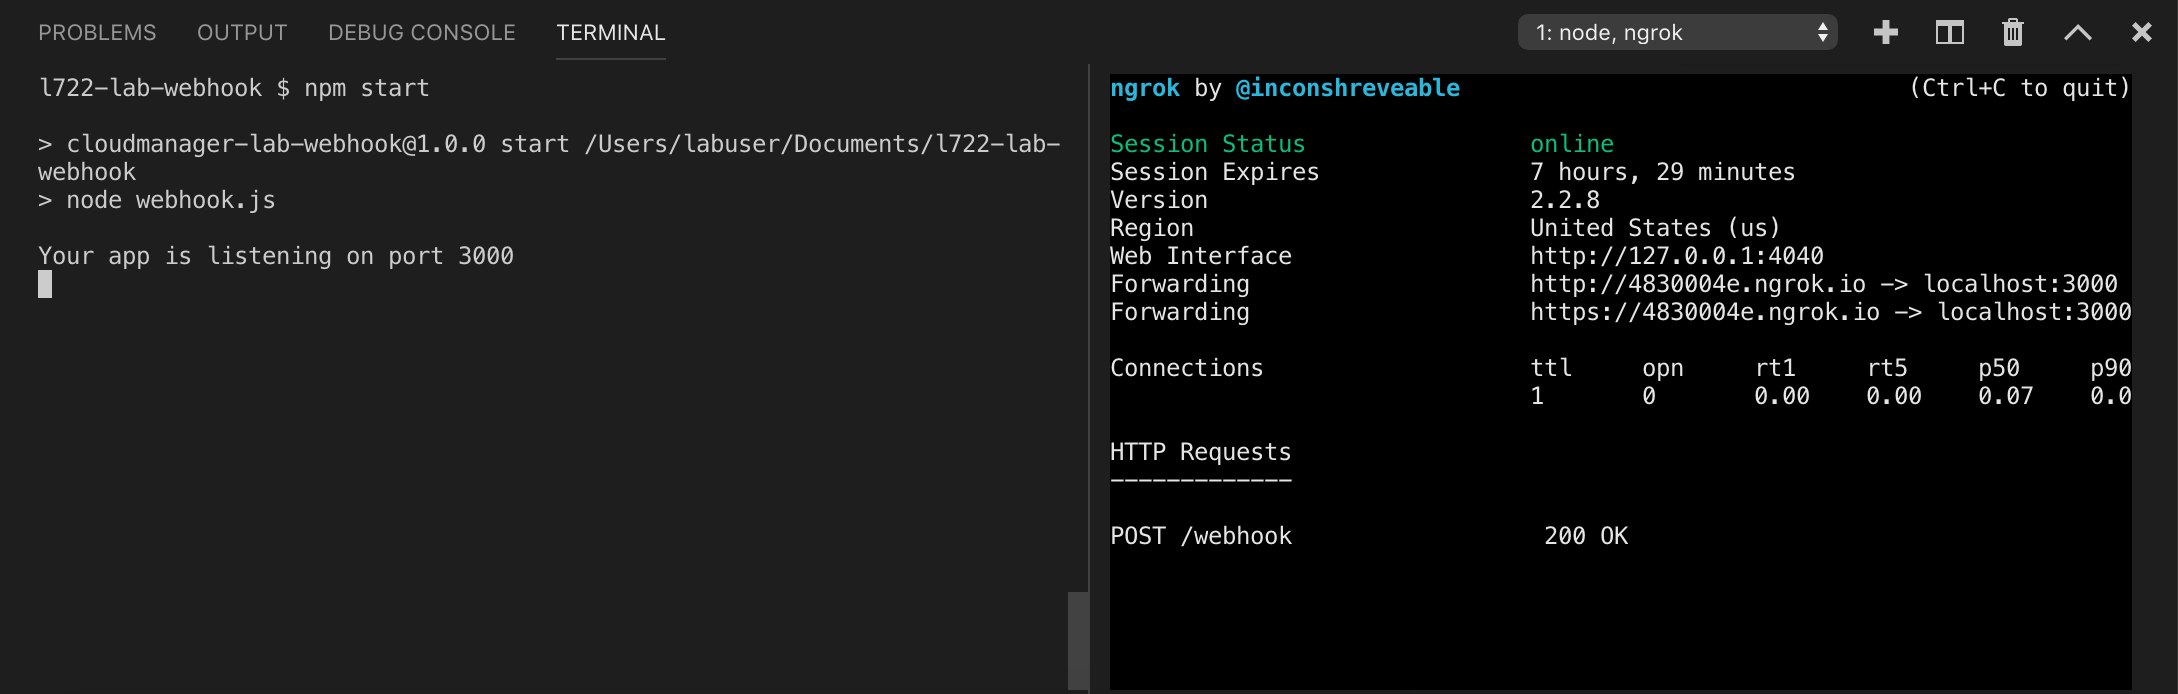
This will open a new Terminal panel in Visual Studio Code with a shell prompt. In this panel, run the command npm run start-simple. This will run the simple.js webhook.
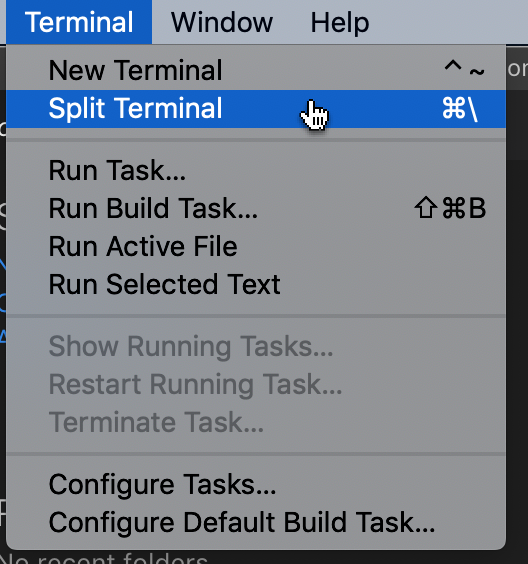
To test this out, we'll use a second terminal panel. To do this, open the Terminal menu and select Split Terminal.
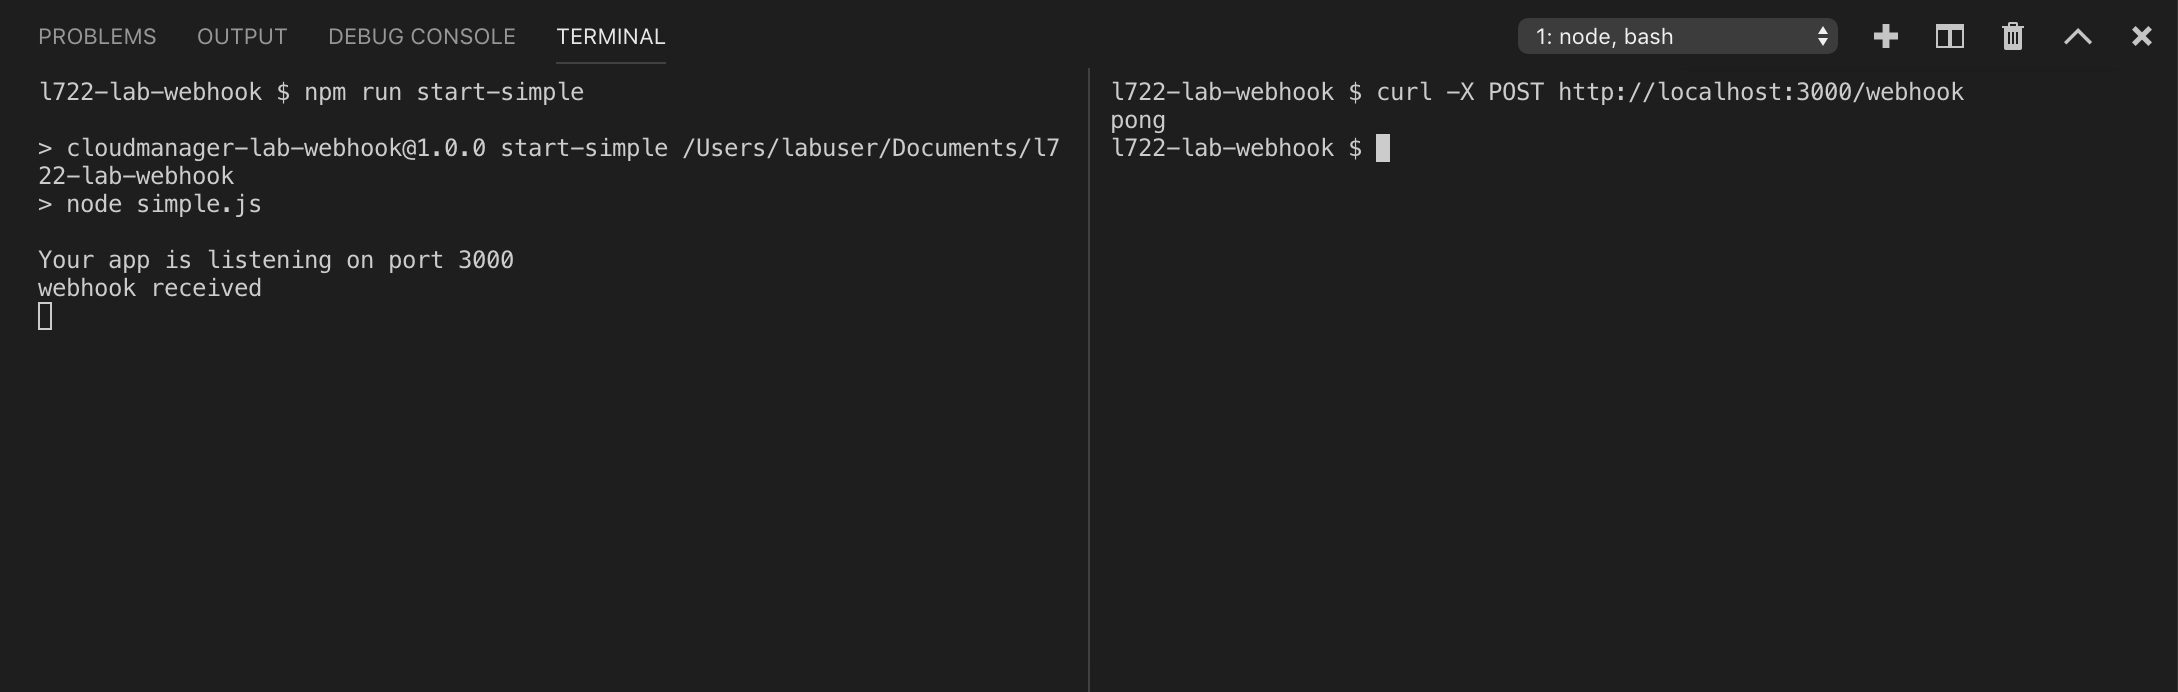
In the second Terminal panel, run the command curl -X POST http://localhost:3000/webhook. What you should see is a simple response (pong) to the request and a message in the first panel showing that a webhook request was received.
Congratulations! You've run a simple webhook.
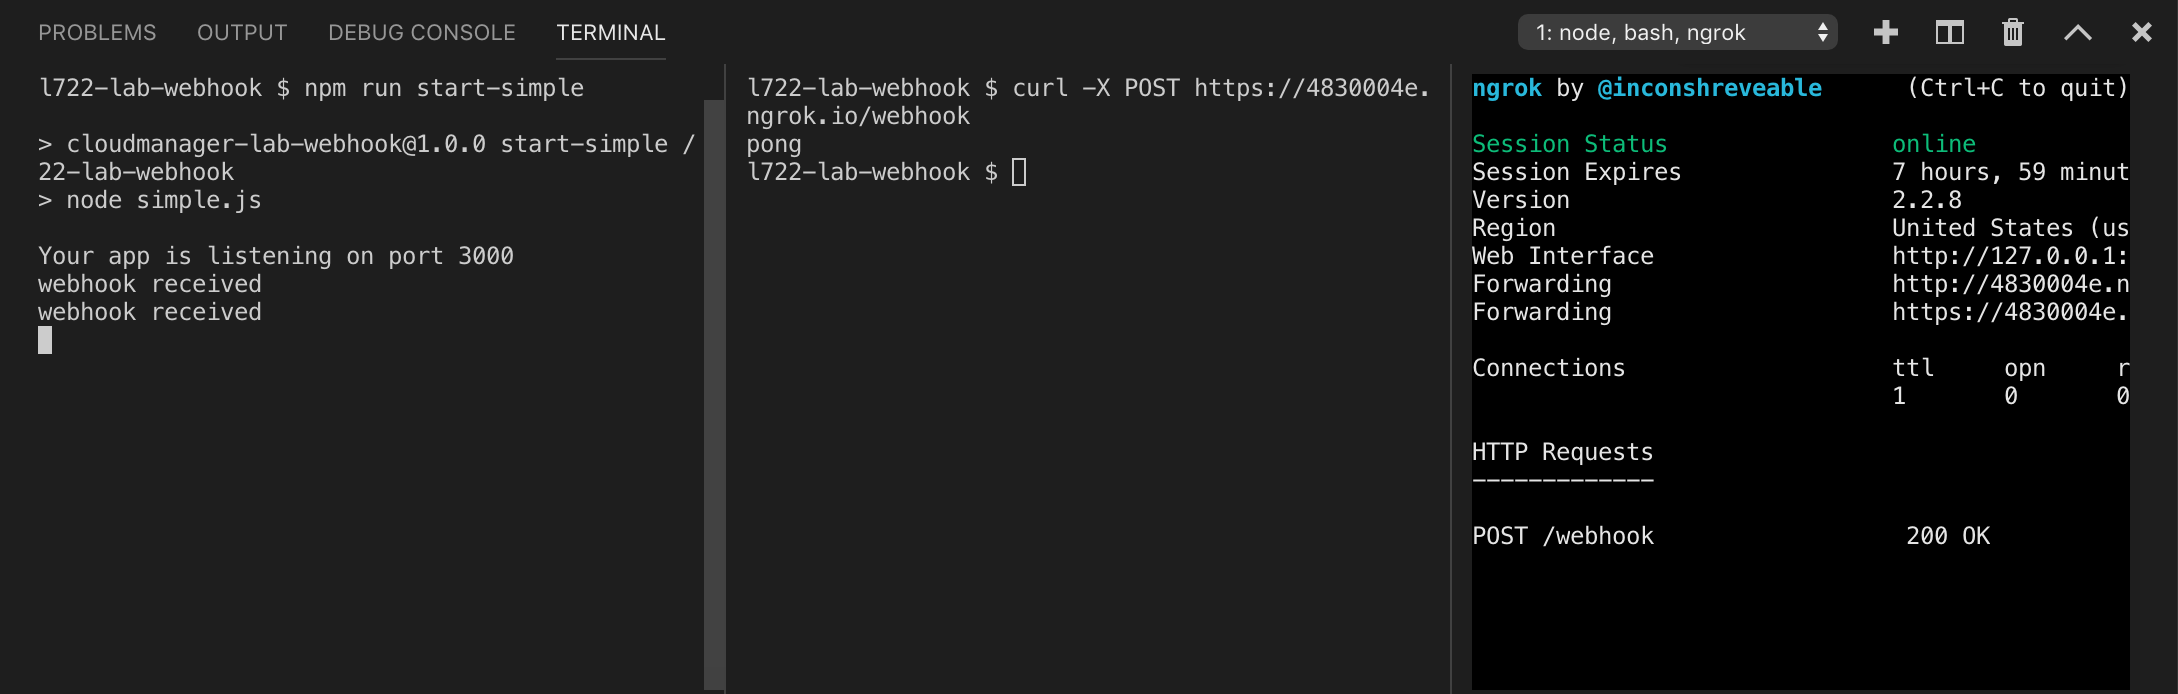
In order for Adobe I/O to access the webhook, it must be accessible on the public internet. Since your lab machines are not publicly accessible, we will use a piece of software named ngrok to create a tunnel which allows Adobe I/O to access the webhook.
To do this, go back to the second Terminal panel in Visual Studio Code and click the plus icon to open a second terminal window. In this window, type
ngrok http 3000
This command instructs ngrok to open a tunnel from a randomly generated URL to port 3000 on your lab workstation.
ngrok will start running and output something like this to confirm it is up and running:
In this screen, the URL generated by ngrok is https://4830004e.ngrok.io
If you register for an ngrok account, you will be able to assign a custom domain name.
If you want to be sure this is working, feel free to open a third split Terminal panel and run curl -X POST <ngrok URL>/webhook.
Now that we have a simple webhook running, we can setup and run the real webhook.
In this lesson, you will be configuring the actual webhook which will be invoked by Adobe I/O and will, in turn, invoke a Microsoft Teams API in order to send a notification when your Cloud Manager pipeline starts.
Before proceeding with this exercise, make sure that ngrok is running; the URL generated each time you start ngrok may be different and that URL will be used in this exercise (and the next one). If you need to stop and restart ngrok, you will need to go back to the Adobe I/O console.
The bulk of the real webhook is already written (in the file webhook.js in the same directory opened in the prior lesson in Visual Studio Code). It does need to be configured so that it can invoke the Cloud Manager API and so that it can post messages to Microsoft Teams.
The webhook uses a Node.js library named dotenv to read its configuration. As the name suggests, this library uses a file named .env. In Visual Studio Code, click on this file in the Explorer to open it.
In the actual git project linked to from the Additional Resources section, this file is not provided; the file .env.template is present and needs to be copied to a file named .env.
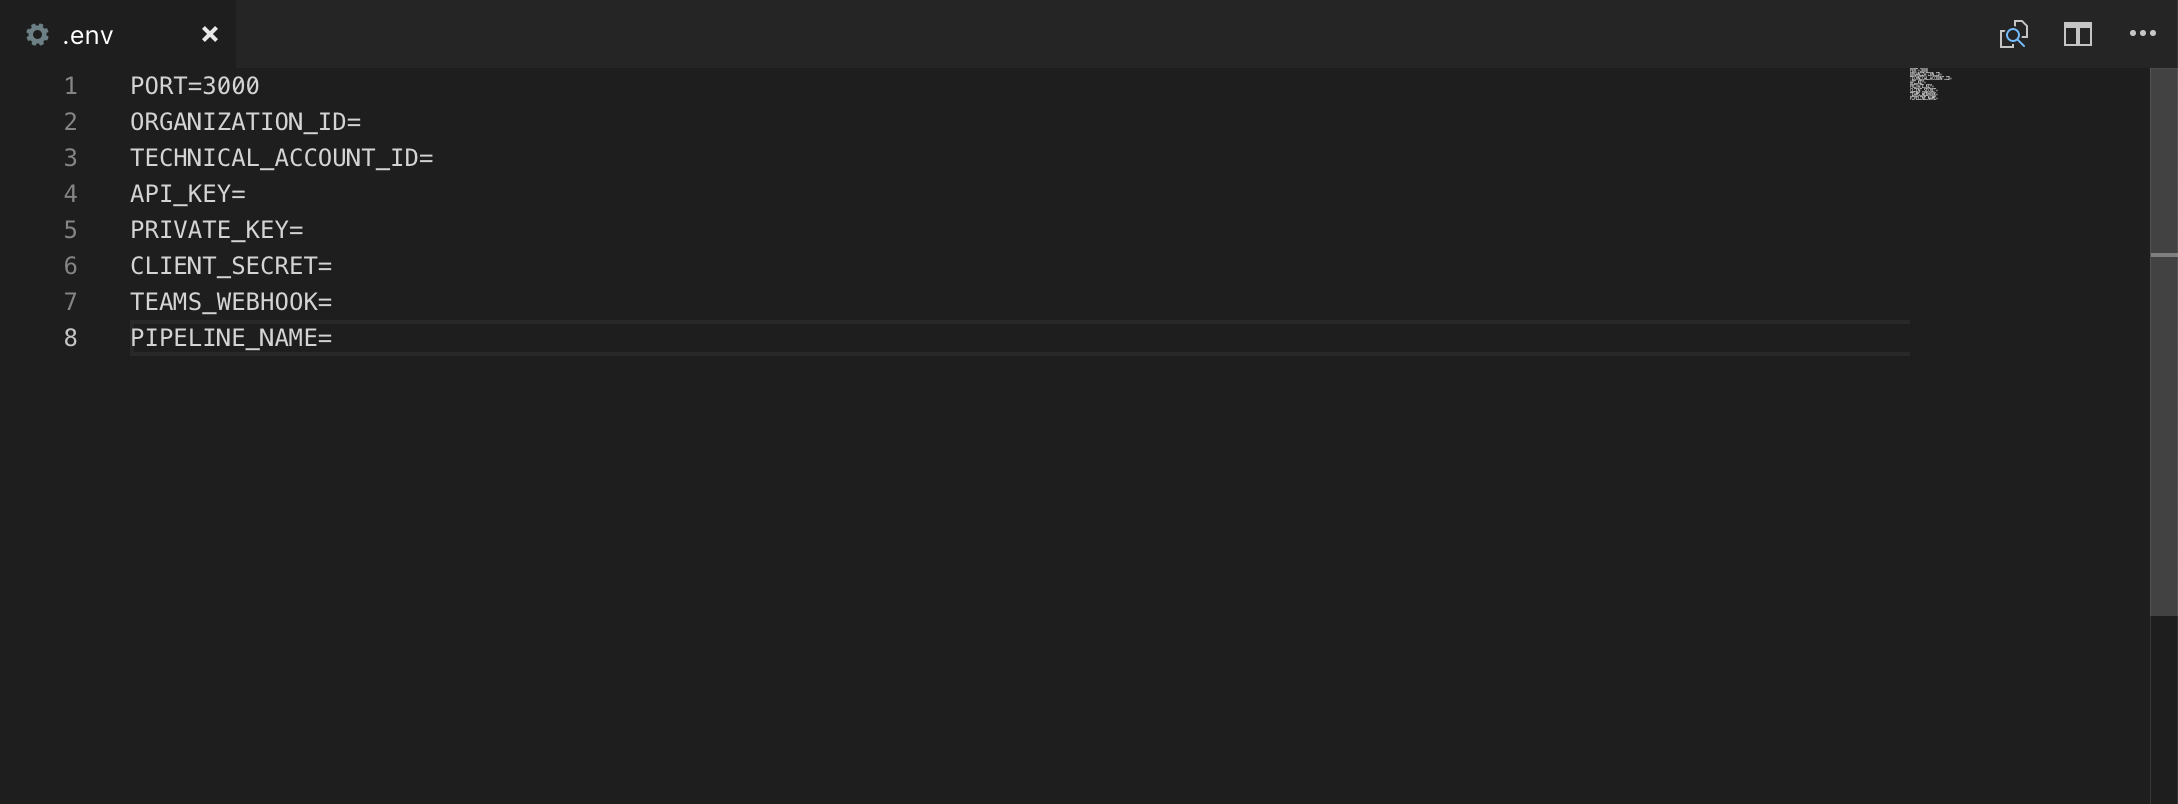
We now need to populate the first handful of lines in this file. To do this, we will register an Integration in the Adobe I/O Console. Before doing that, we need to generate a cryptographic certificate in order to securely sign requests to Adobe I/O.
Select the first Terminal panel (i.e. the one where the webhook is running, not the panel in which ngrok is running) and type Ctrl-C.
openssl req -x509 -sha256 -nodes -days 365 -newkey rsa:2048 -keyout private.key -out certificate.crt
You'll be prompted here for a series of values. The actual values don't really matter for the purposes of this lab, but you must at minimum provide an email address.
Now, switch back to Chrome. Open a new tab and navigate to https://console.adobe.io/
You shouldn't have to log in, but if you do, use the same credentials as used in Lesson 1.
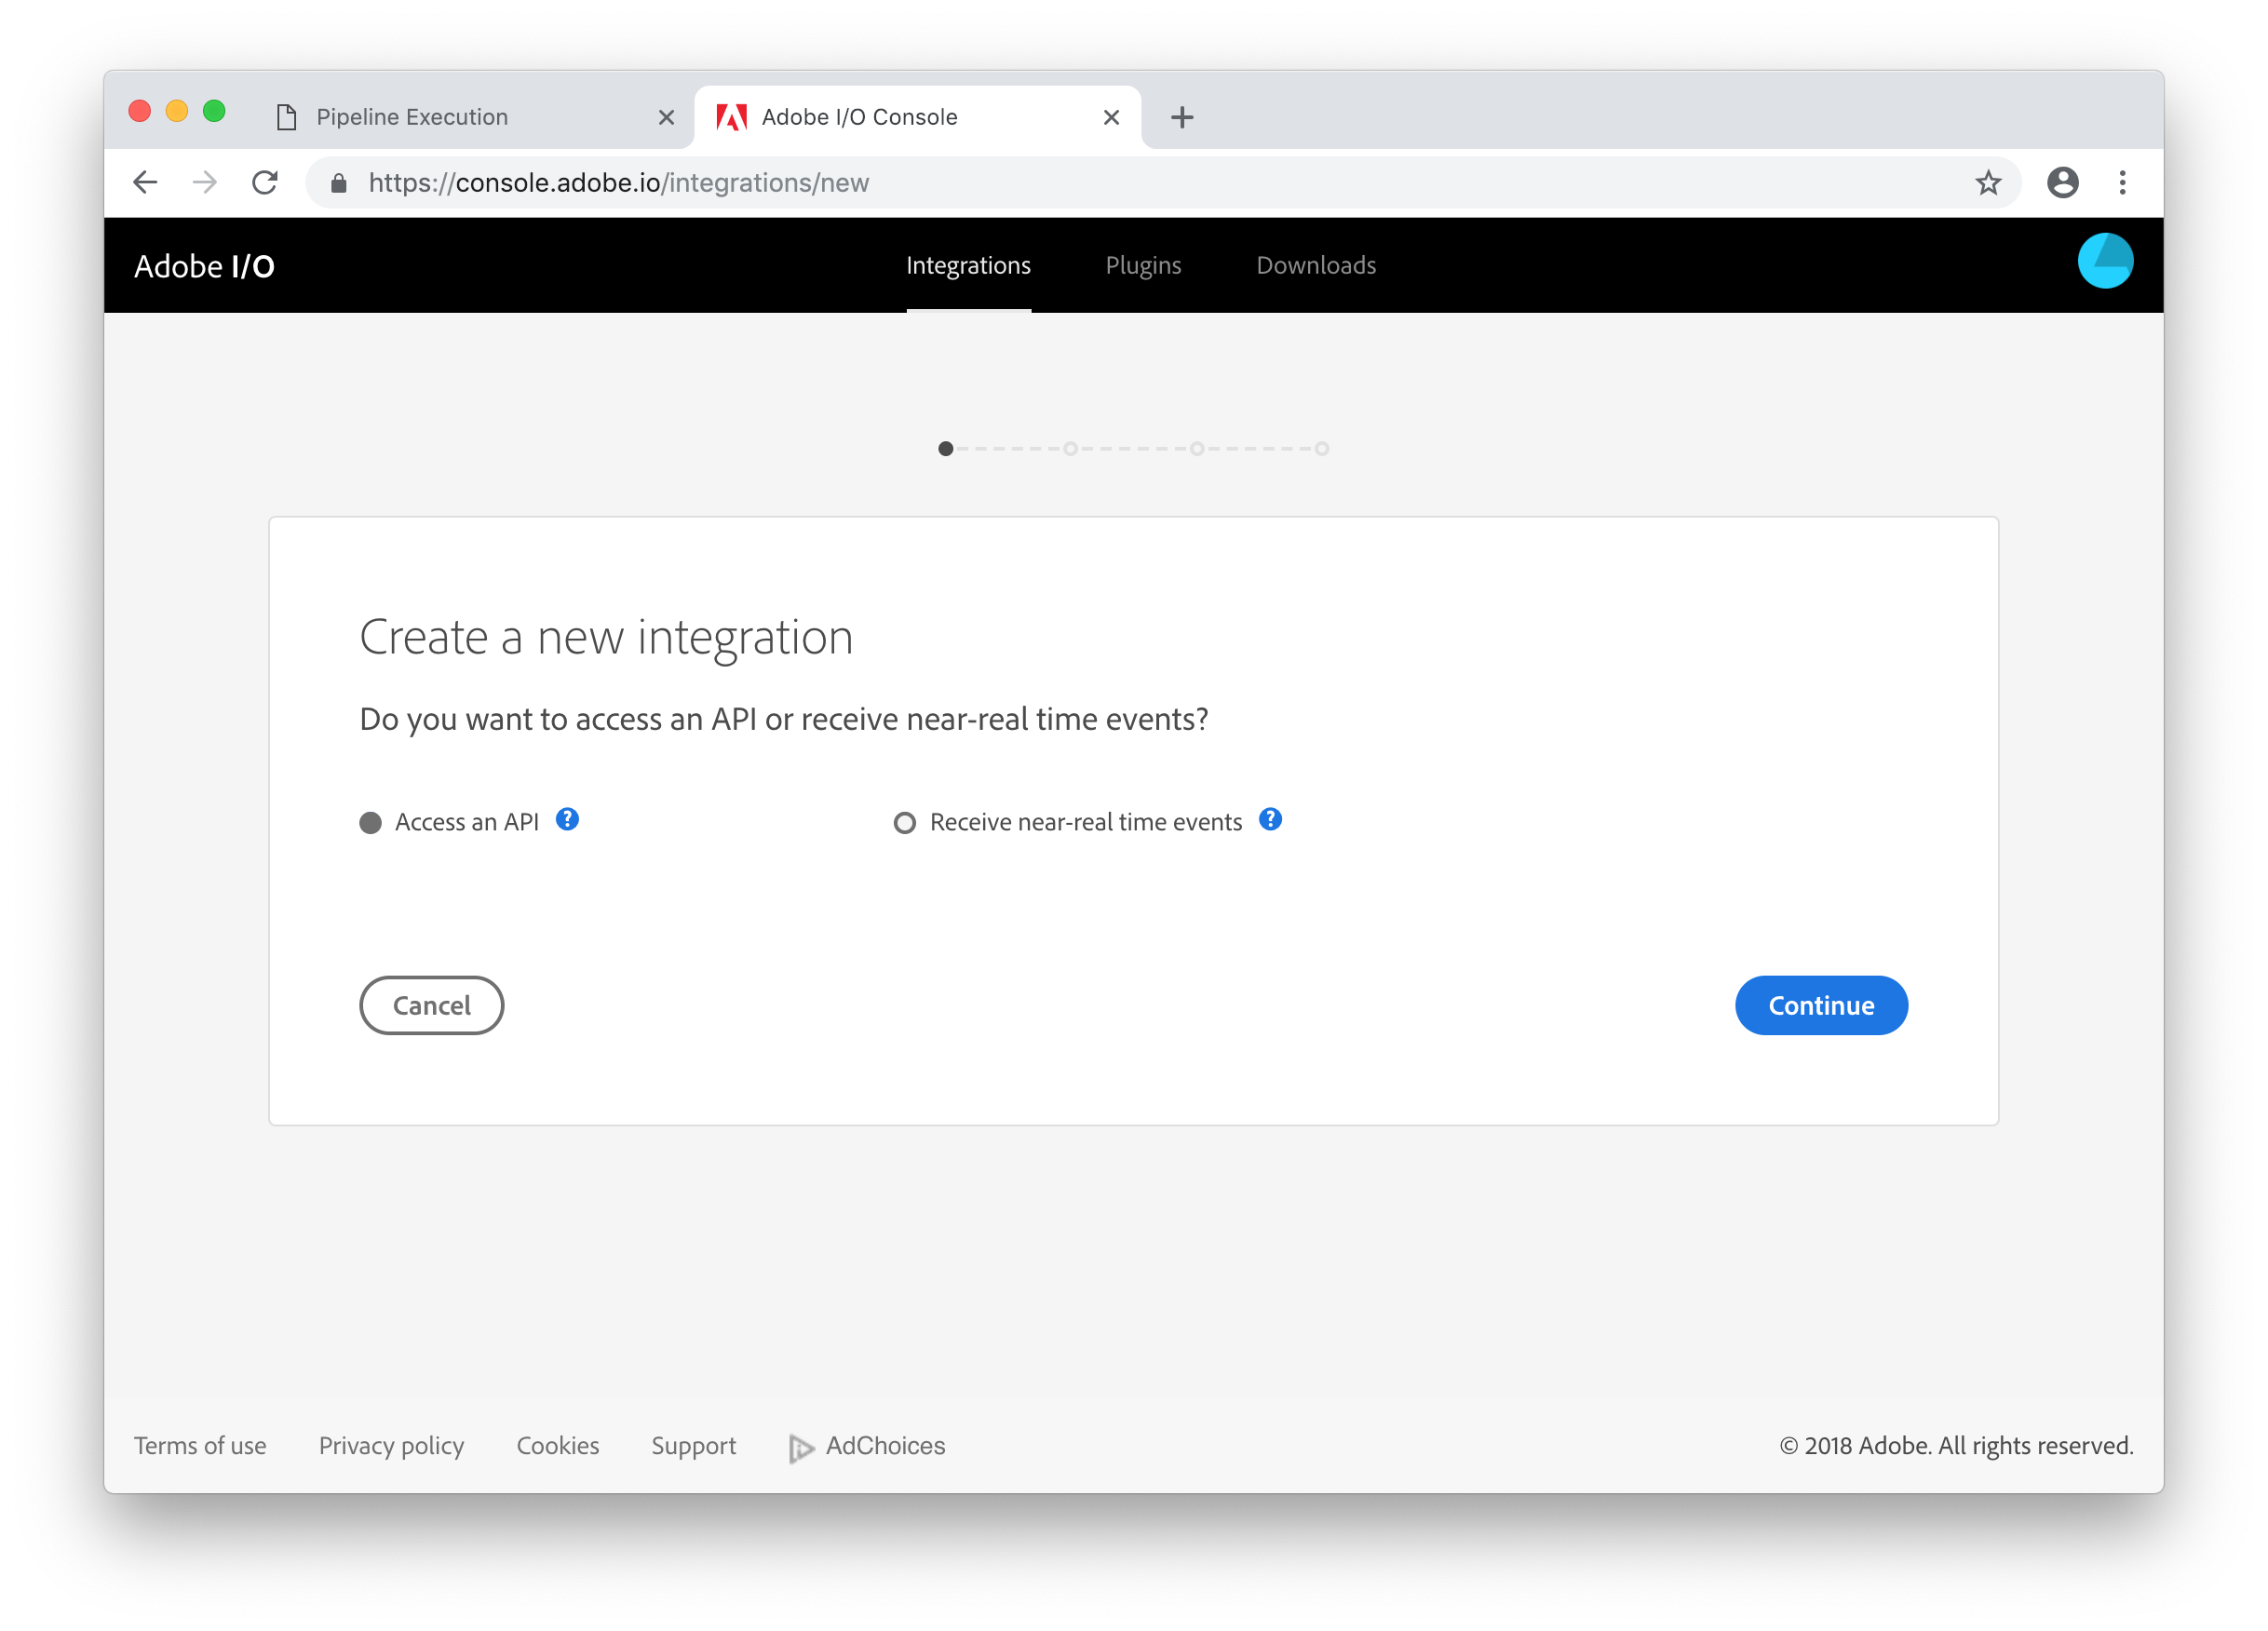
Click the New integration button.
The integration (which is how Adobe I/O refers to API clients) will both need to receive events and make API calls, so the answer to the question "Do you want to access an API or receive near-real time events" is actually both, but Adobe I/O requires this to be a two-step process. Leave Access an API selected (it should be the default) and click Continue.
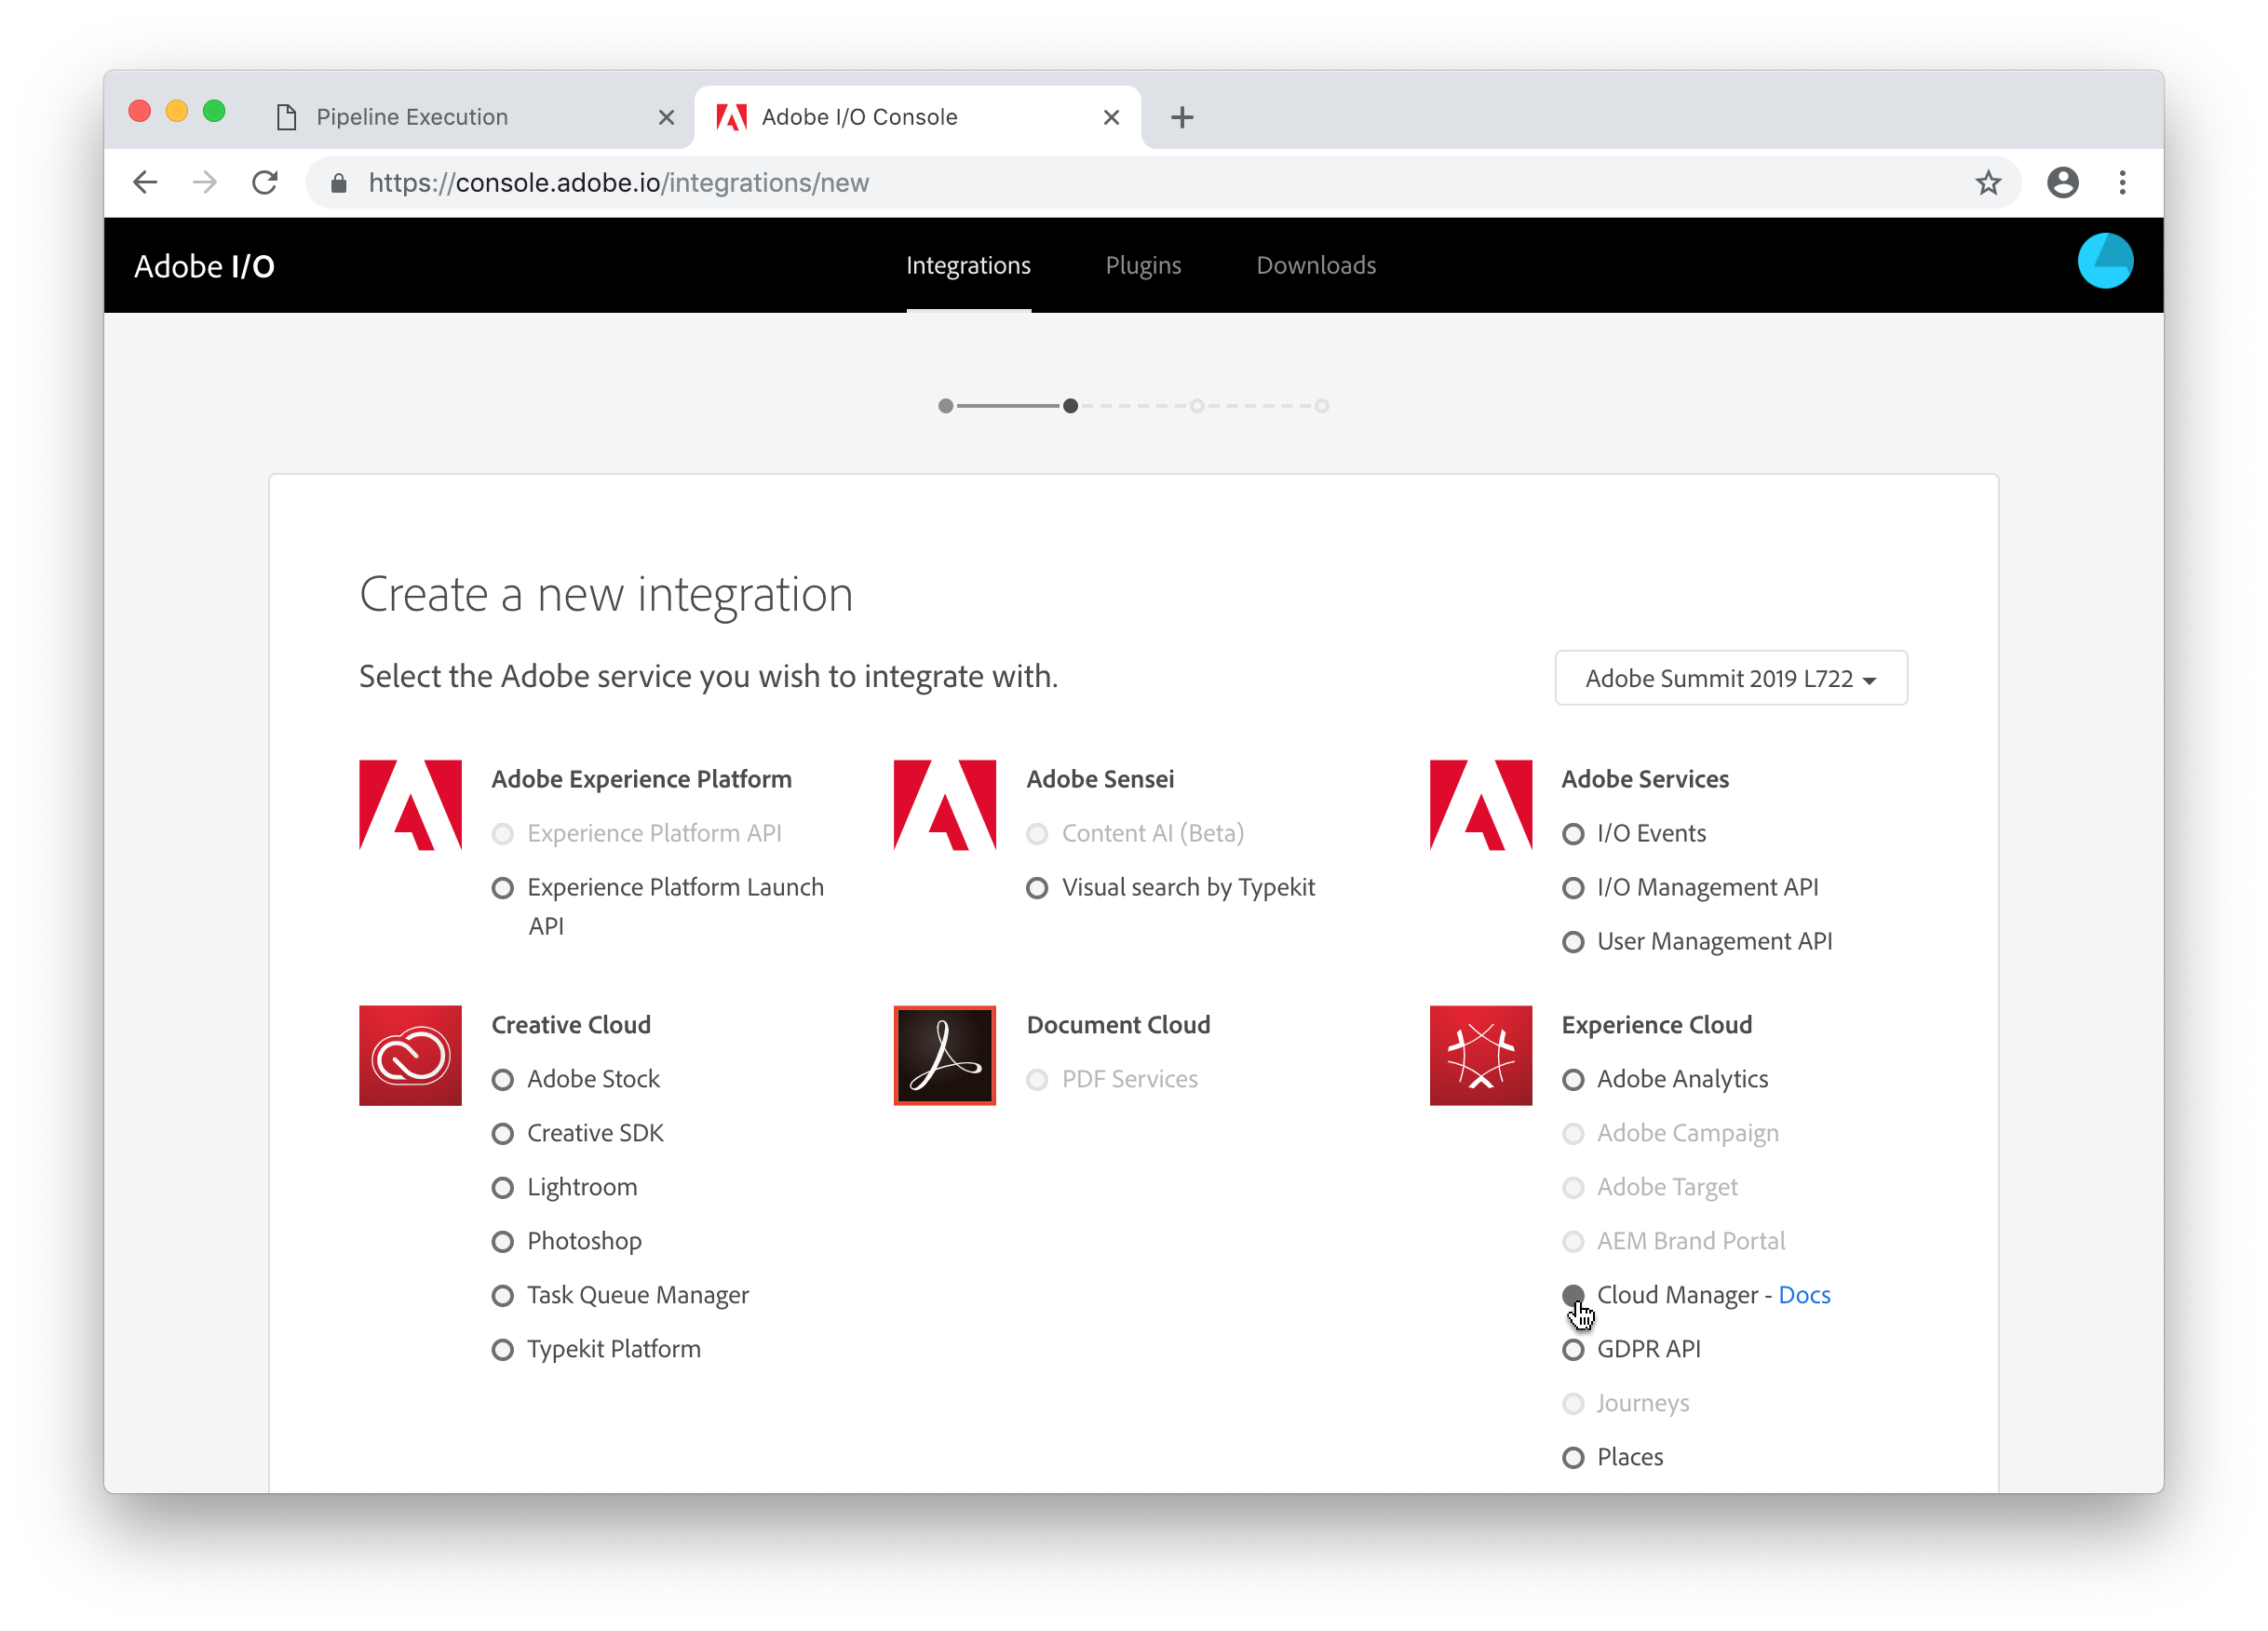
Select Cloud Manager and click the Continue button.
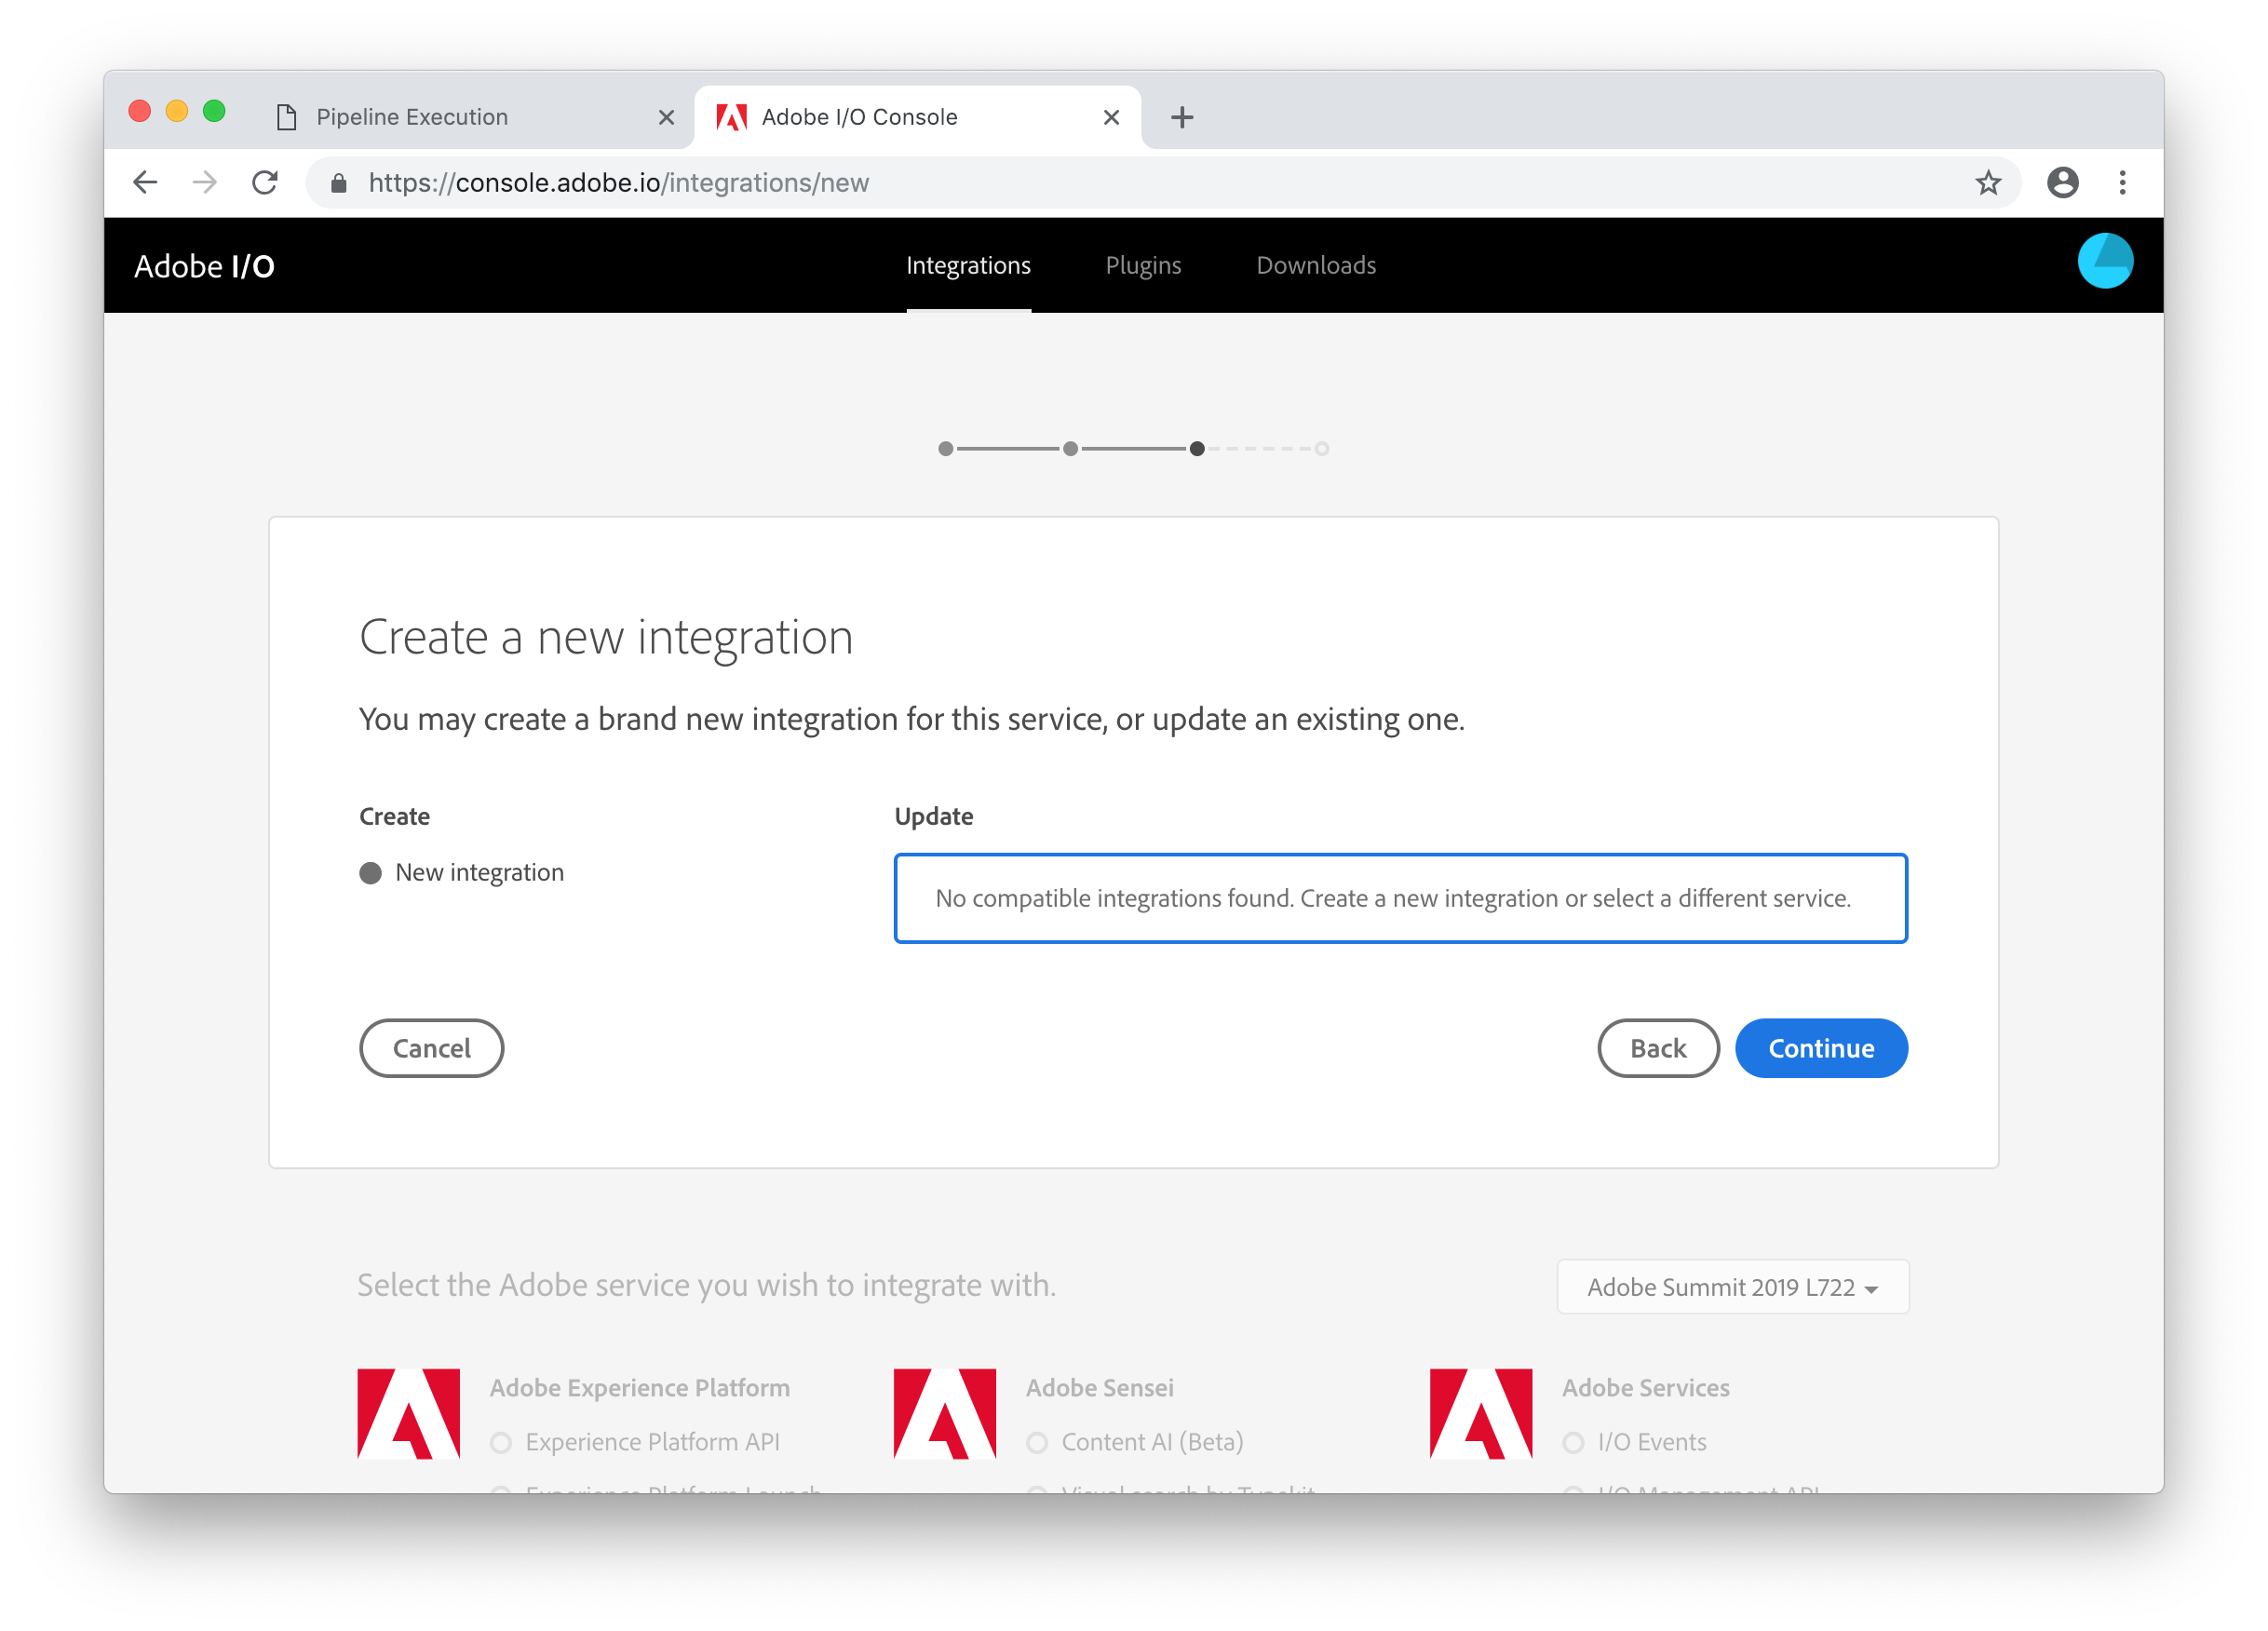
On the Create a new integration screen, ensure New integration is selected and click the Continue button.
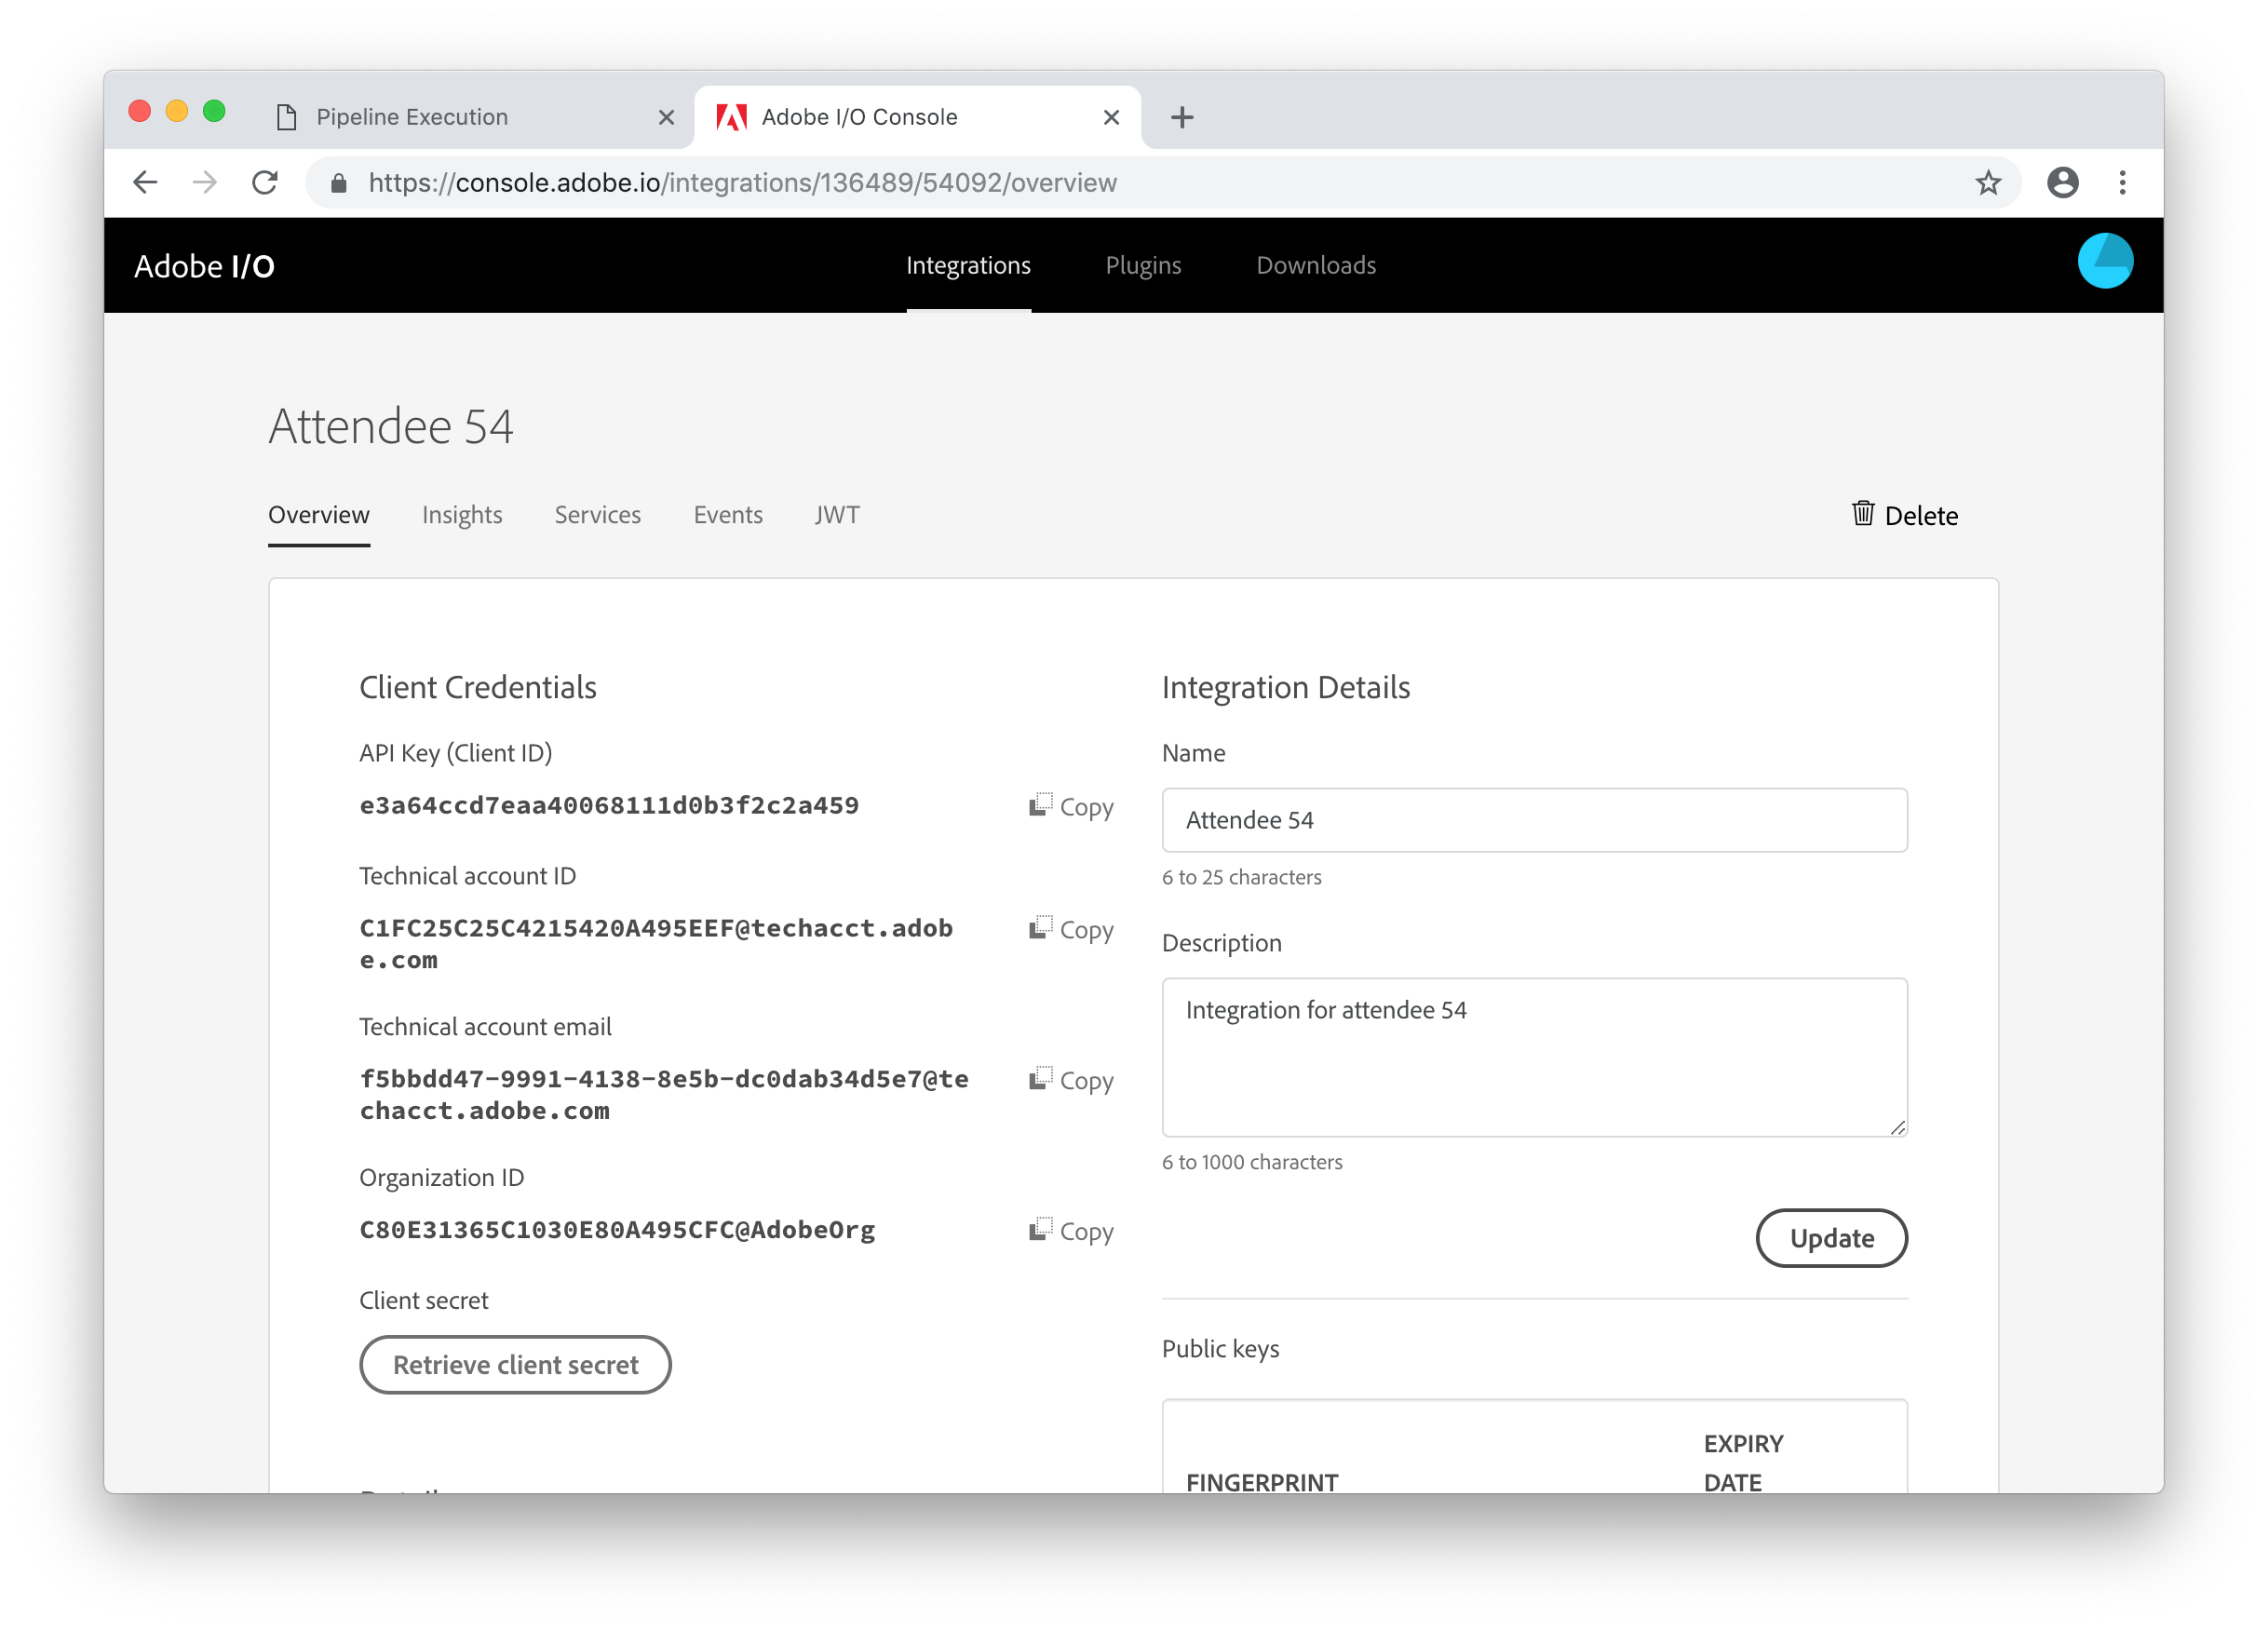
Provide a name and description for your integration.
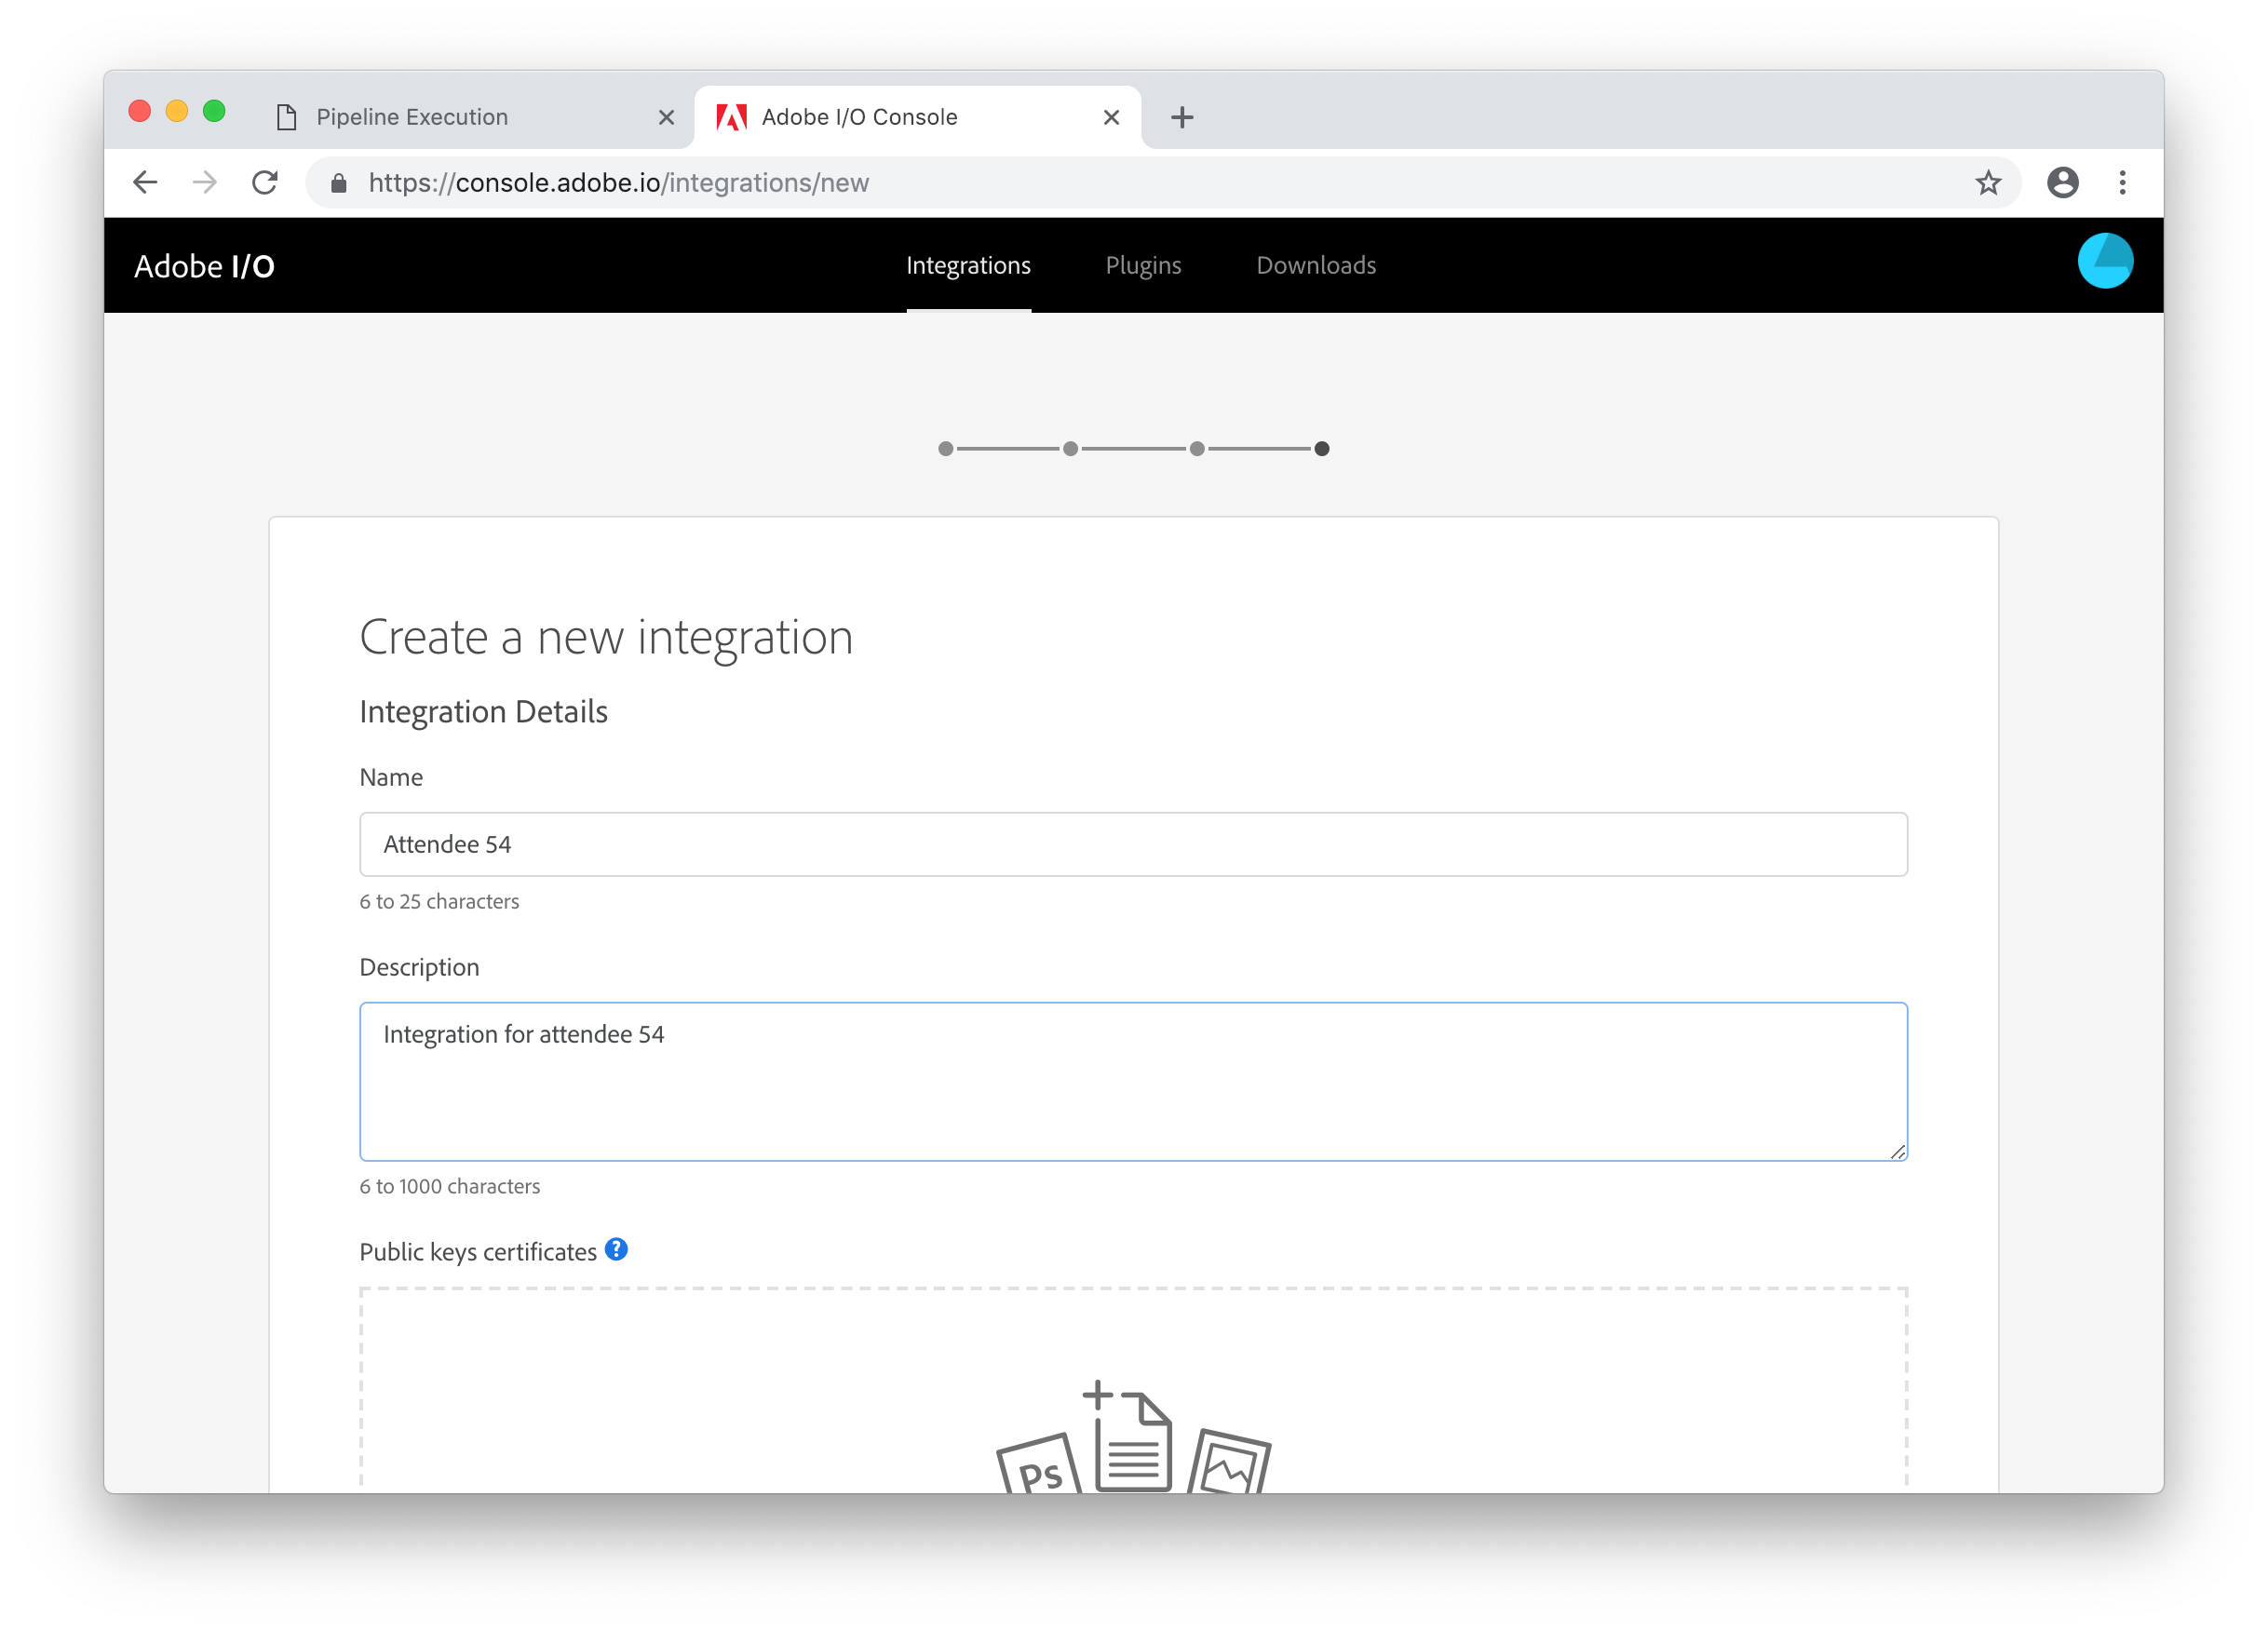
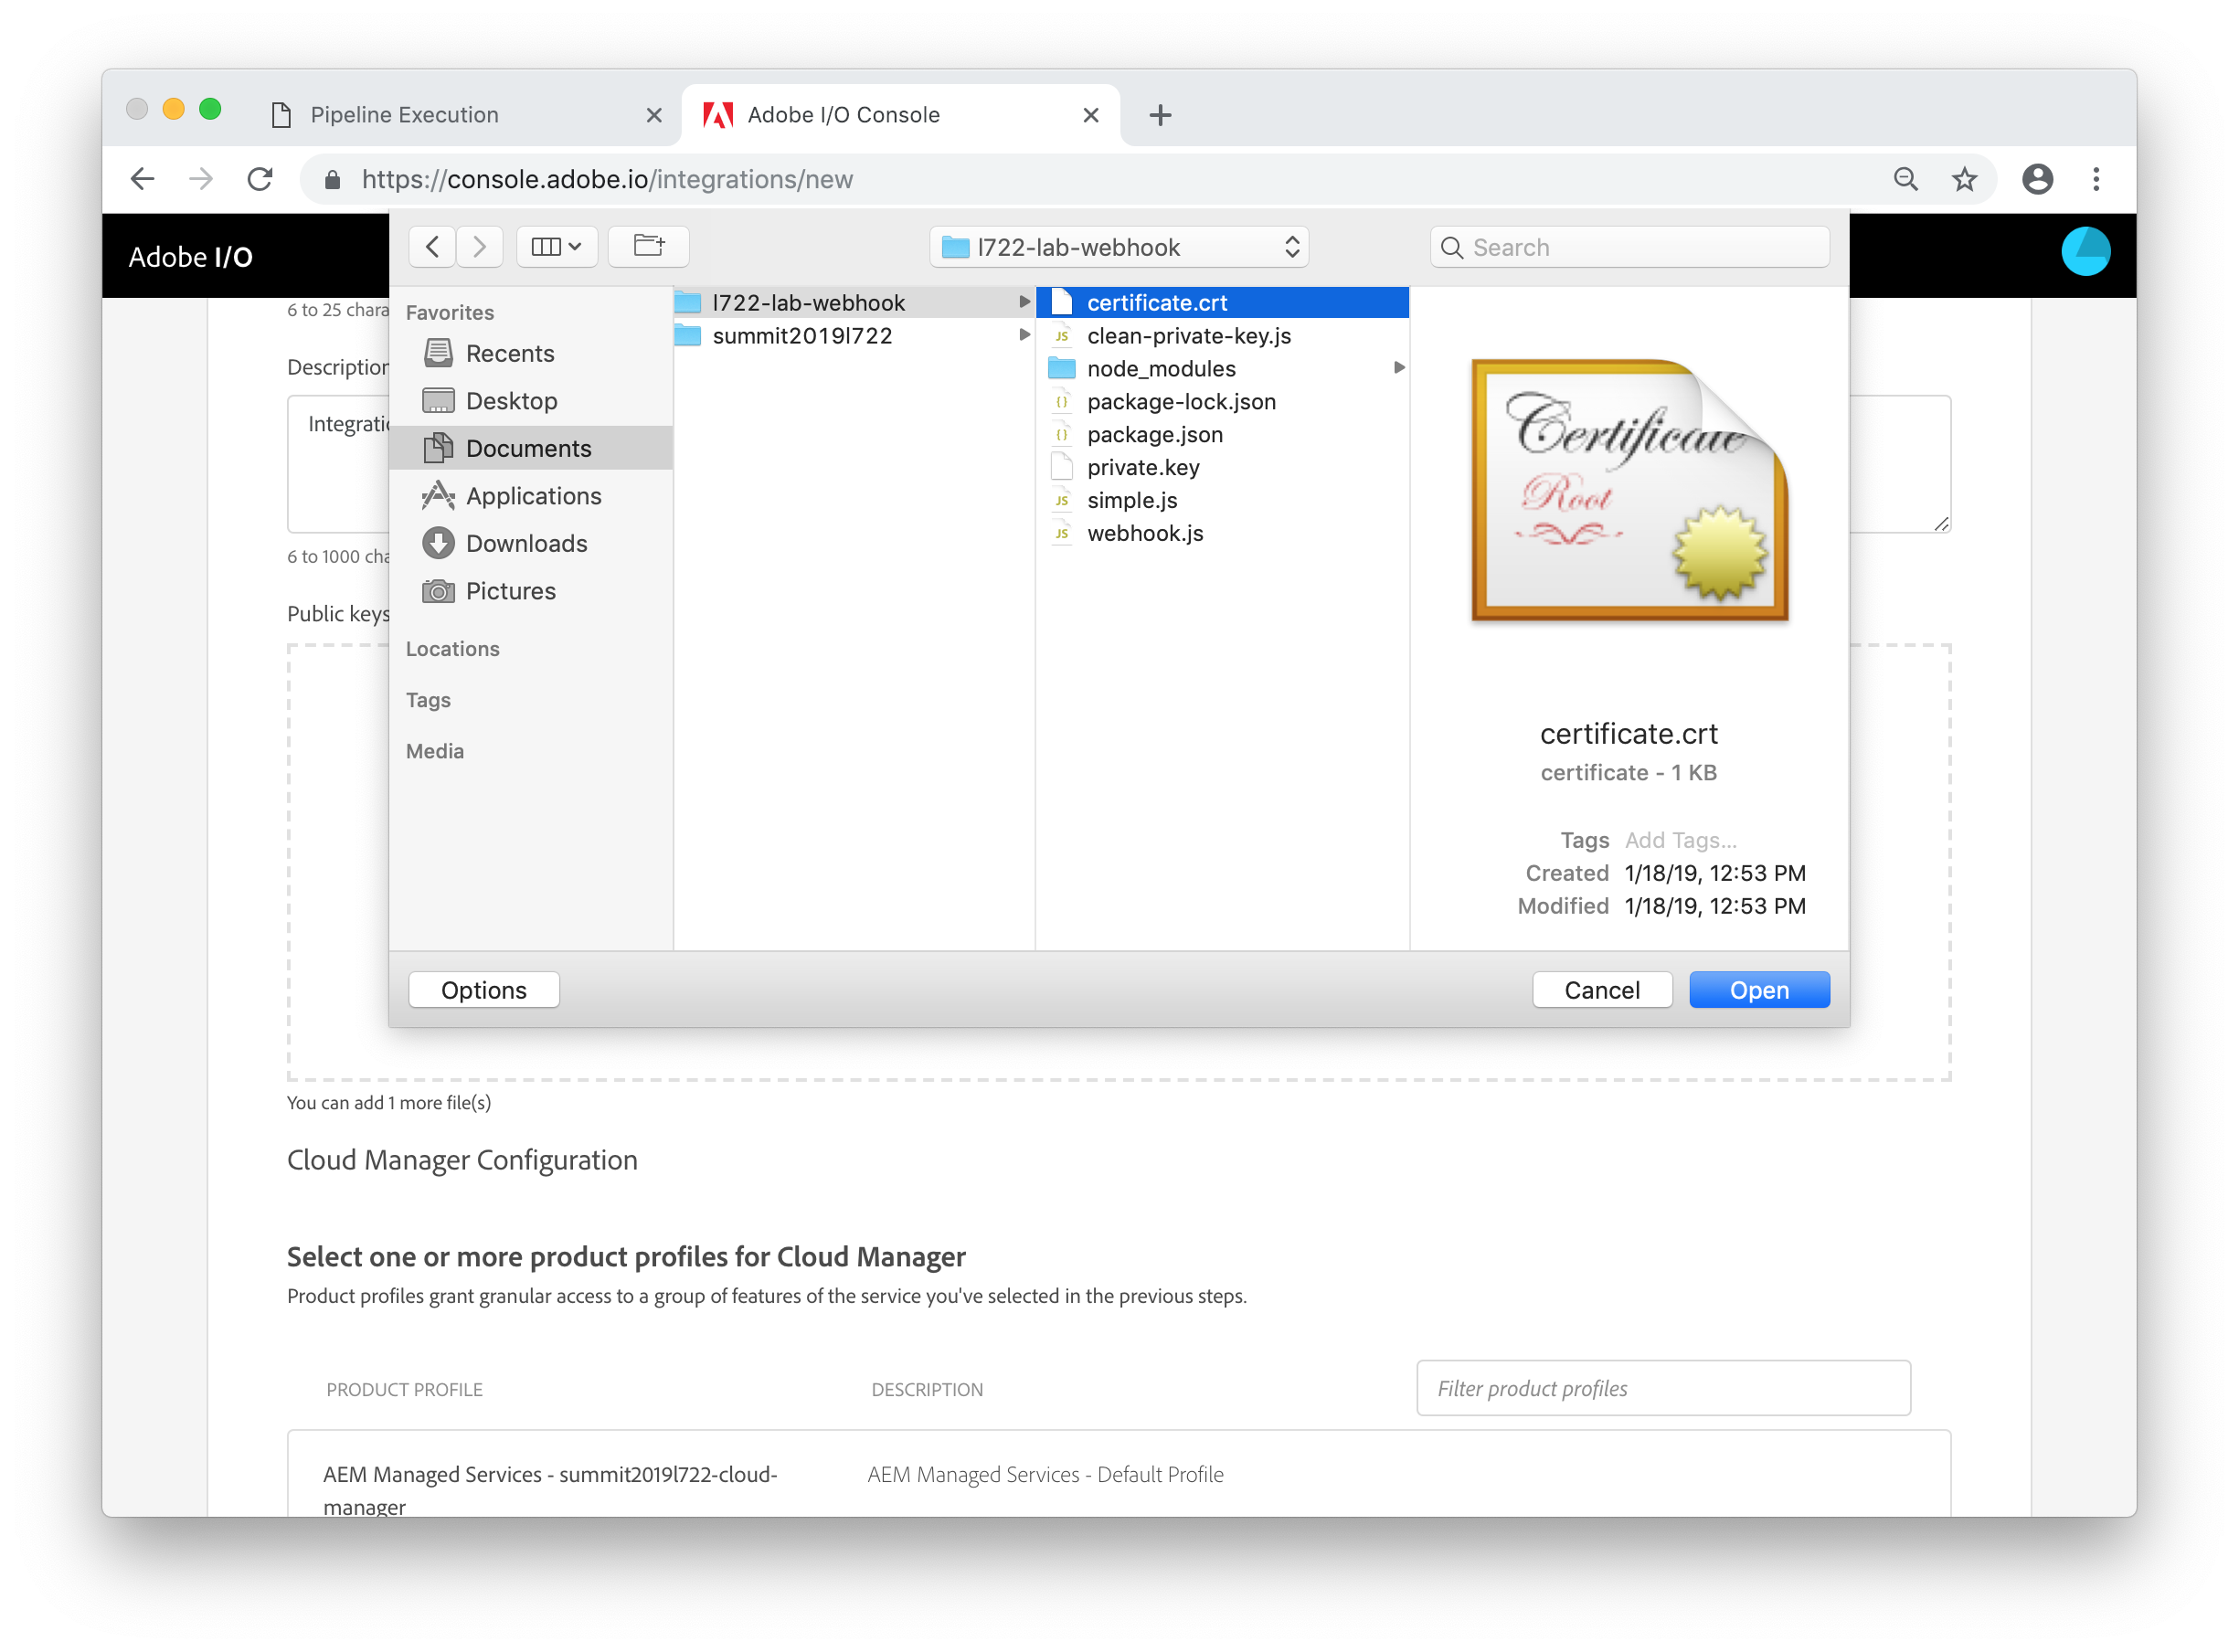
In the Public keys certificates box, click the Select a File link and open the certificate.crt file created by openssl.
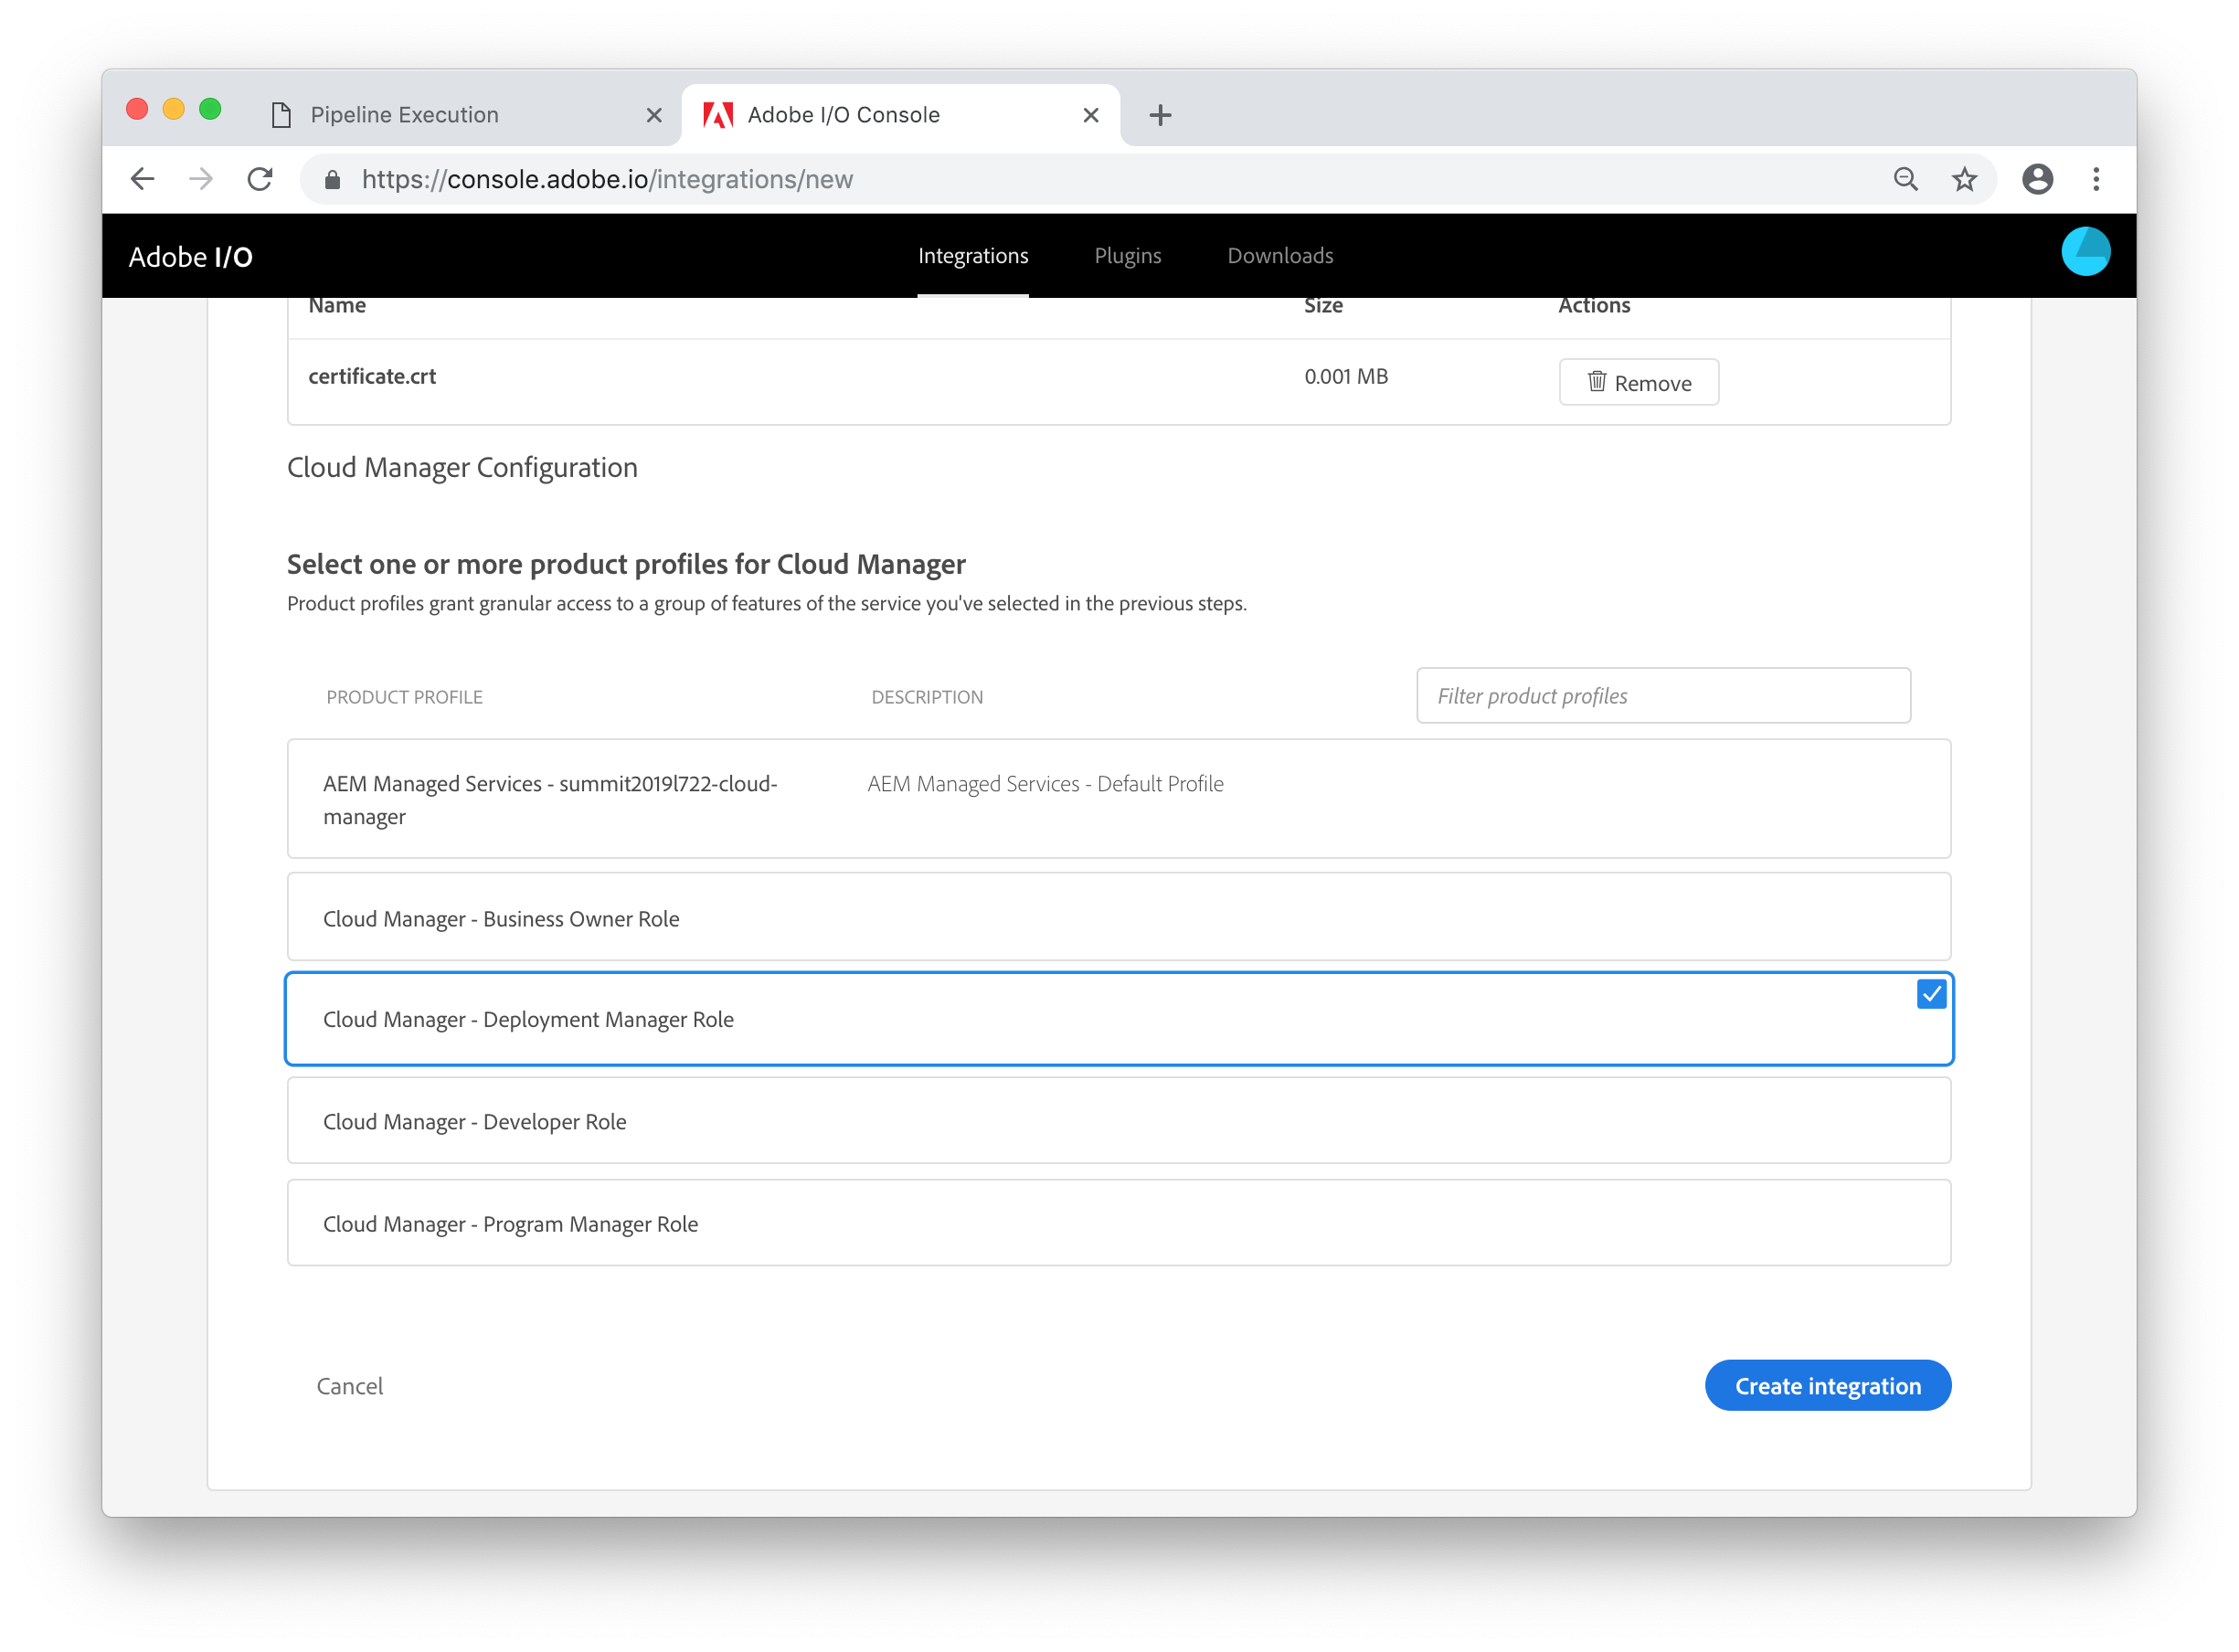
Finally, select the Cloud Manager - Deployment Manager Role profile from the product profile list and click the Create integration button.
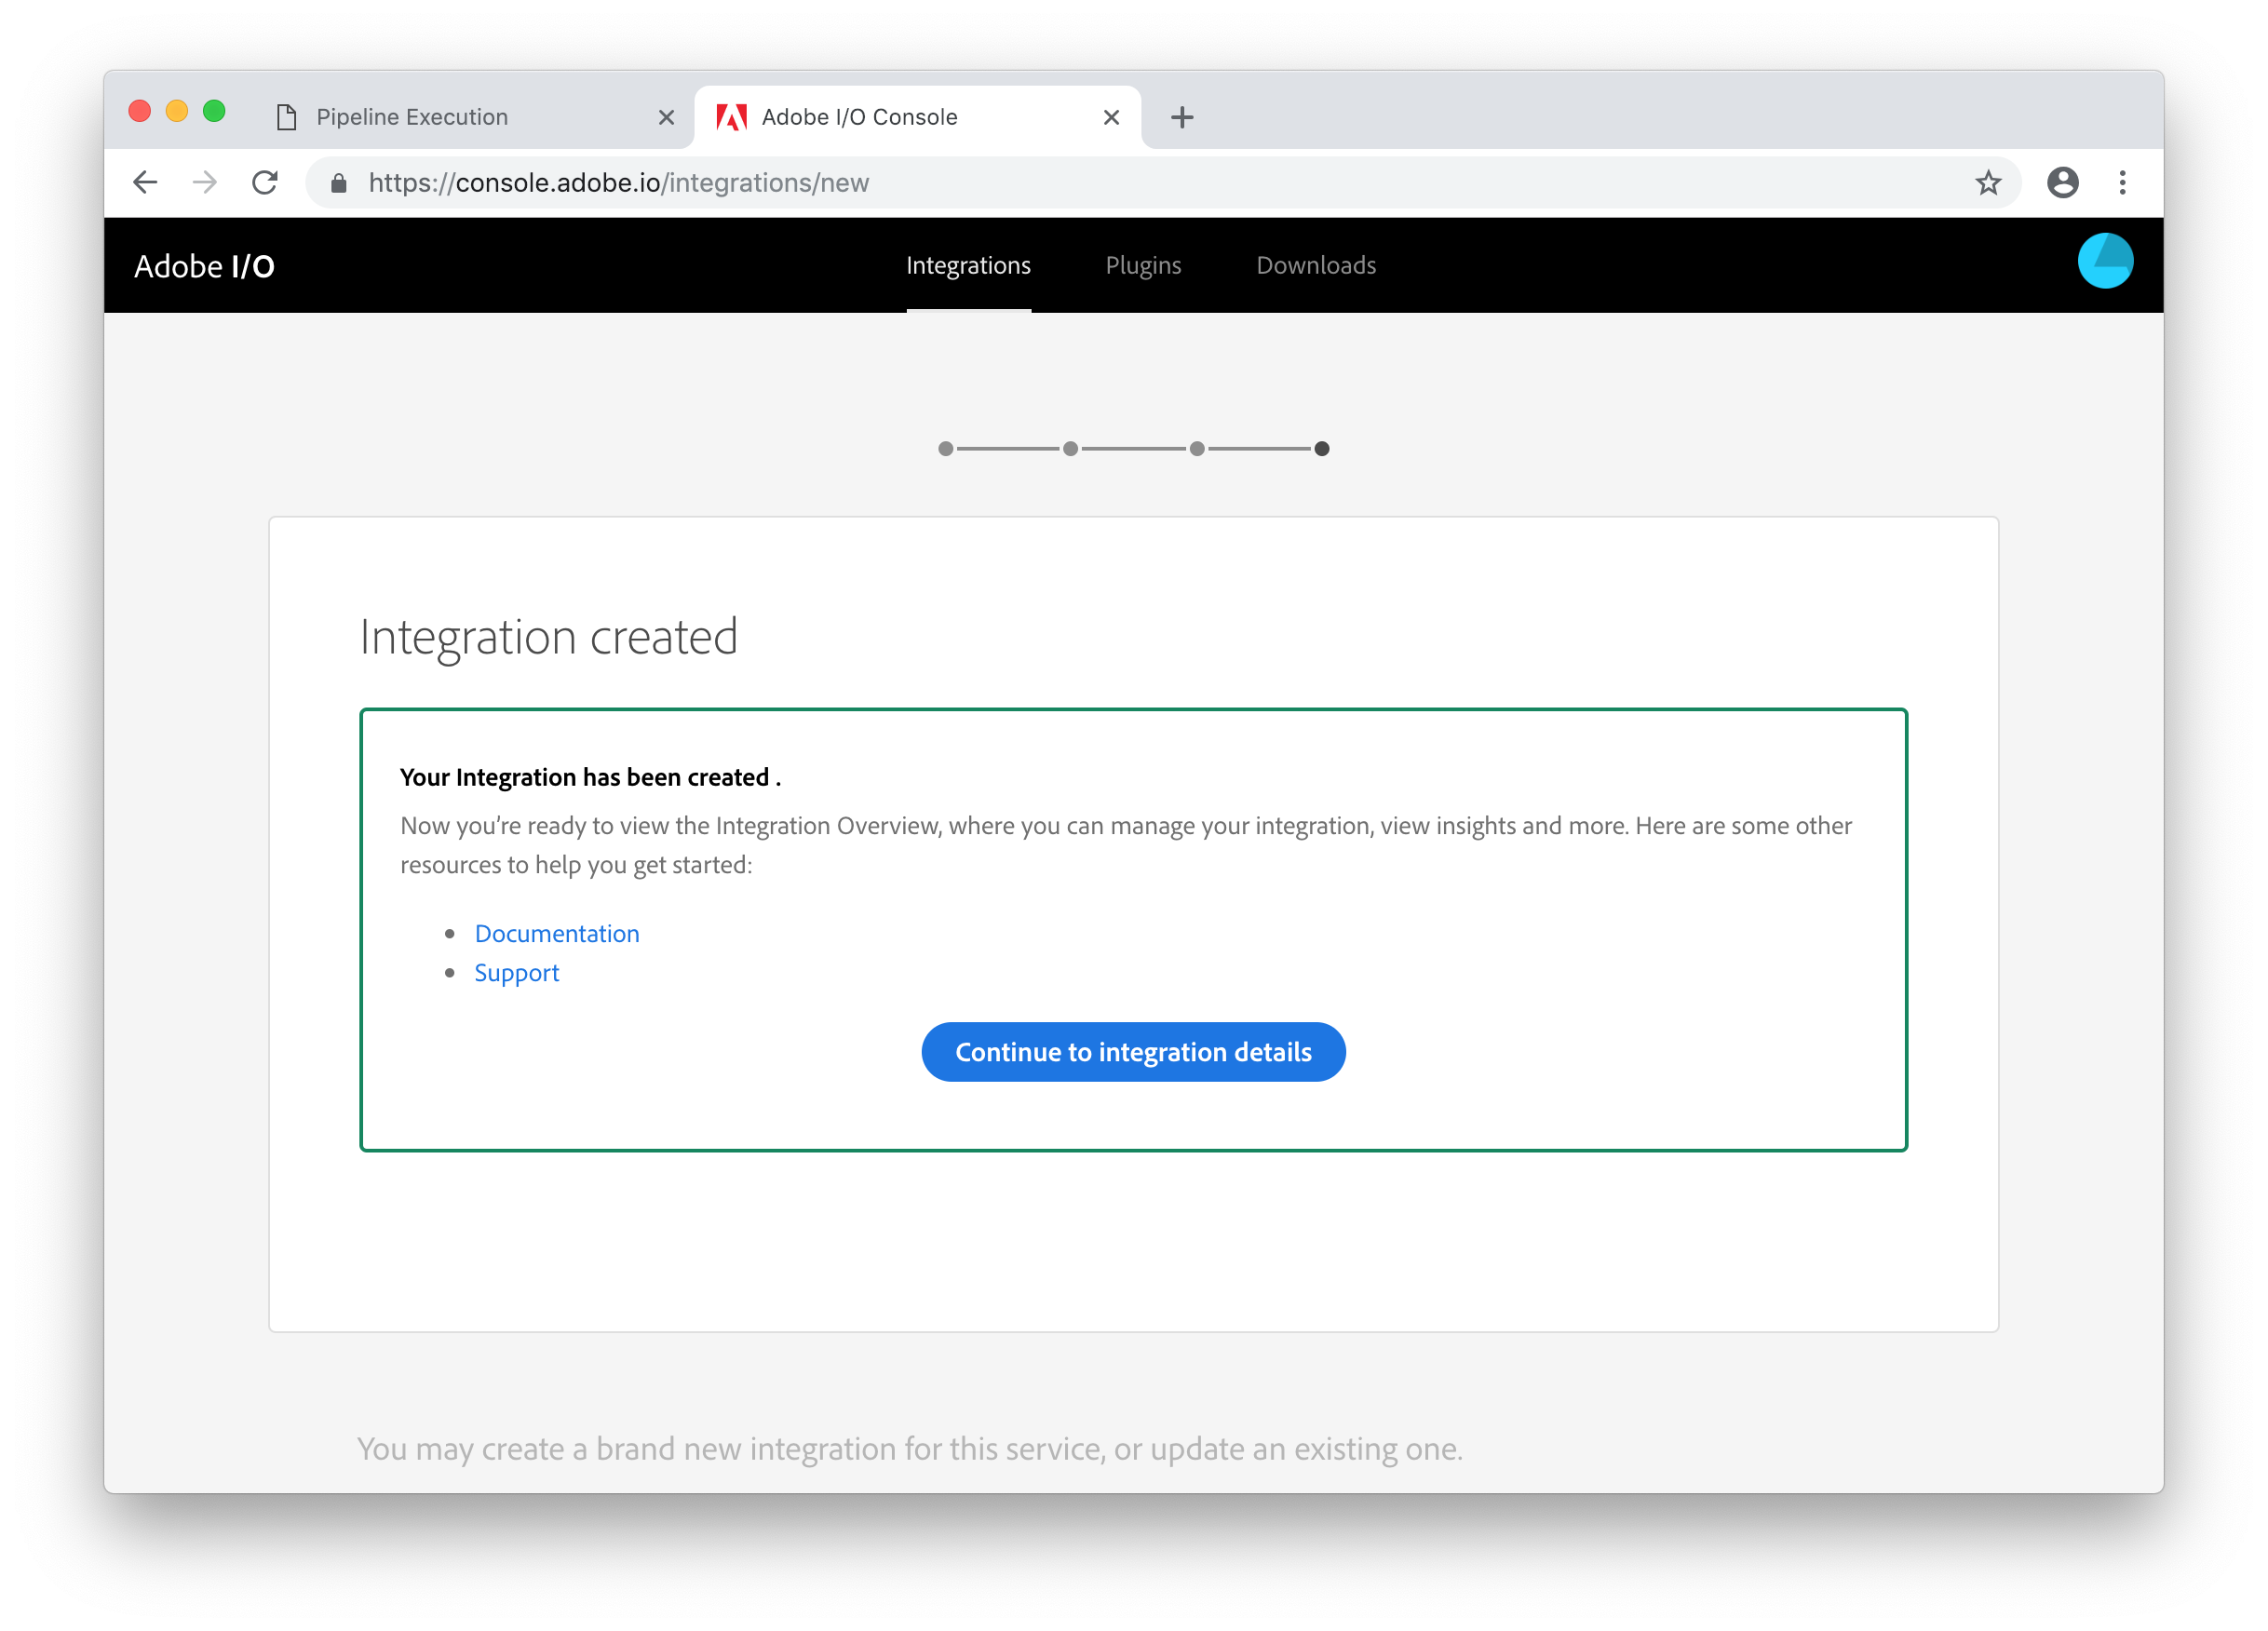
You'll now see a confirmation screen saying that your integration has been created. Click the Continue to integration details button to see the details of the created integration.
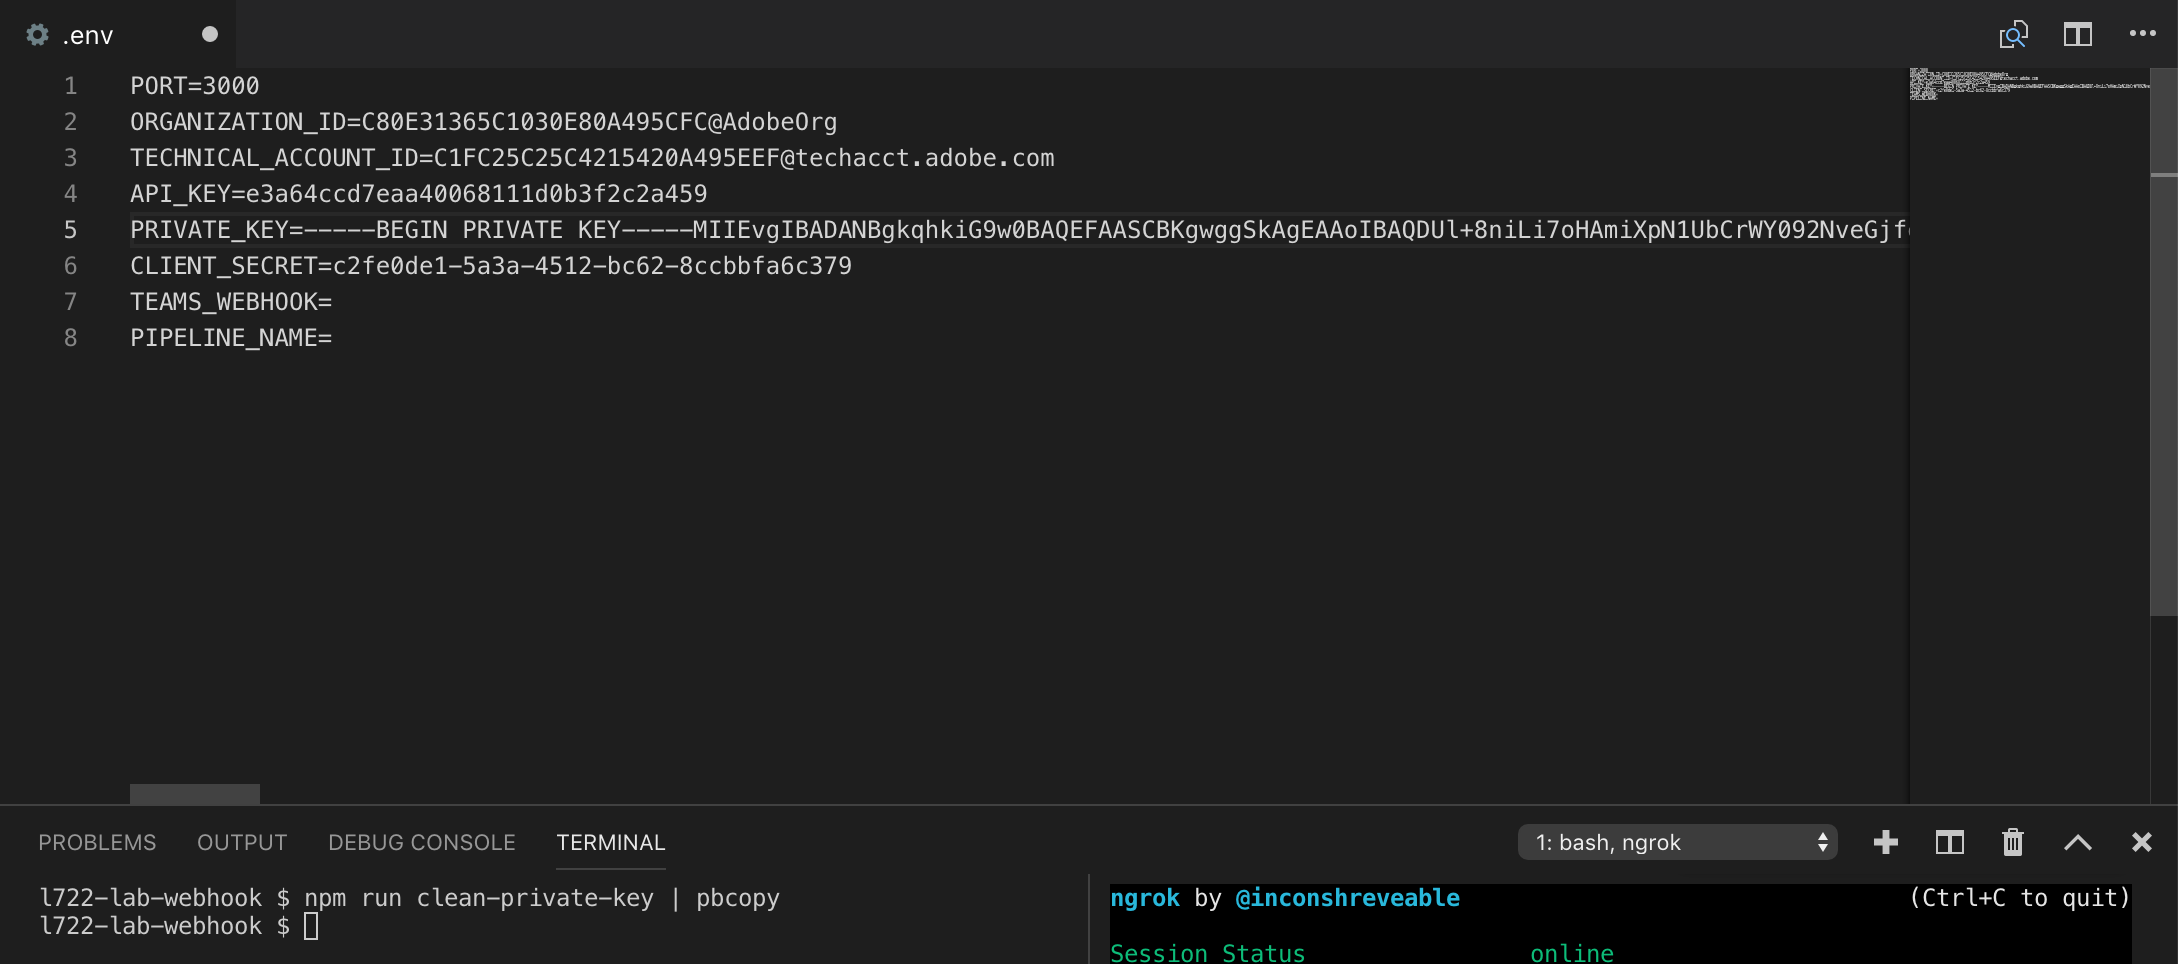
You now need to copy and paste the values for the API Key, Technical account ID, Organization ID, and Client Secret from this screen into the .env file in Visual Studio Code. Use the Copy button next to each value (clicking the Retrieve client secret button to show the Client Secret) and paste them into the corresponding variable in the .env file.
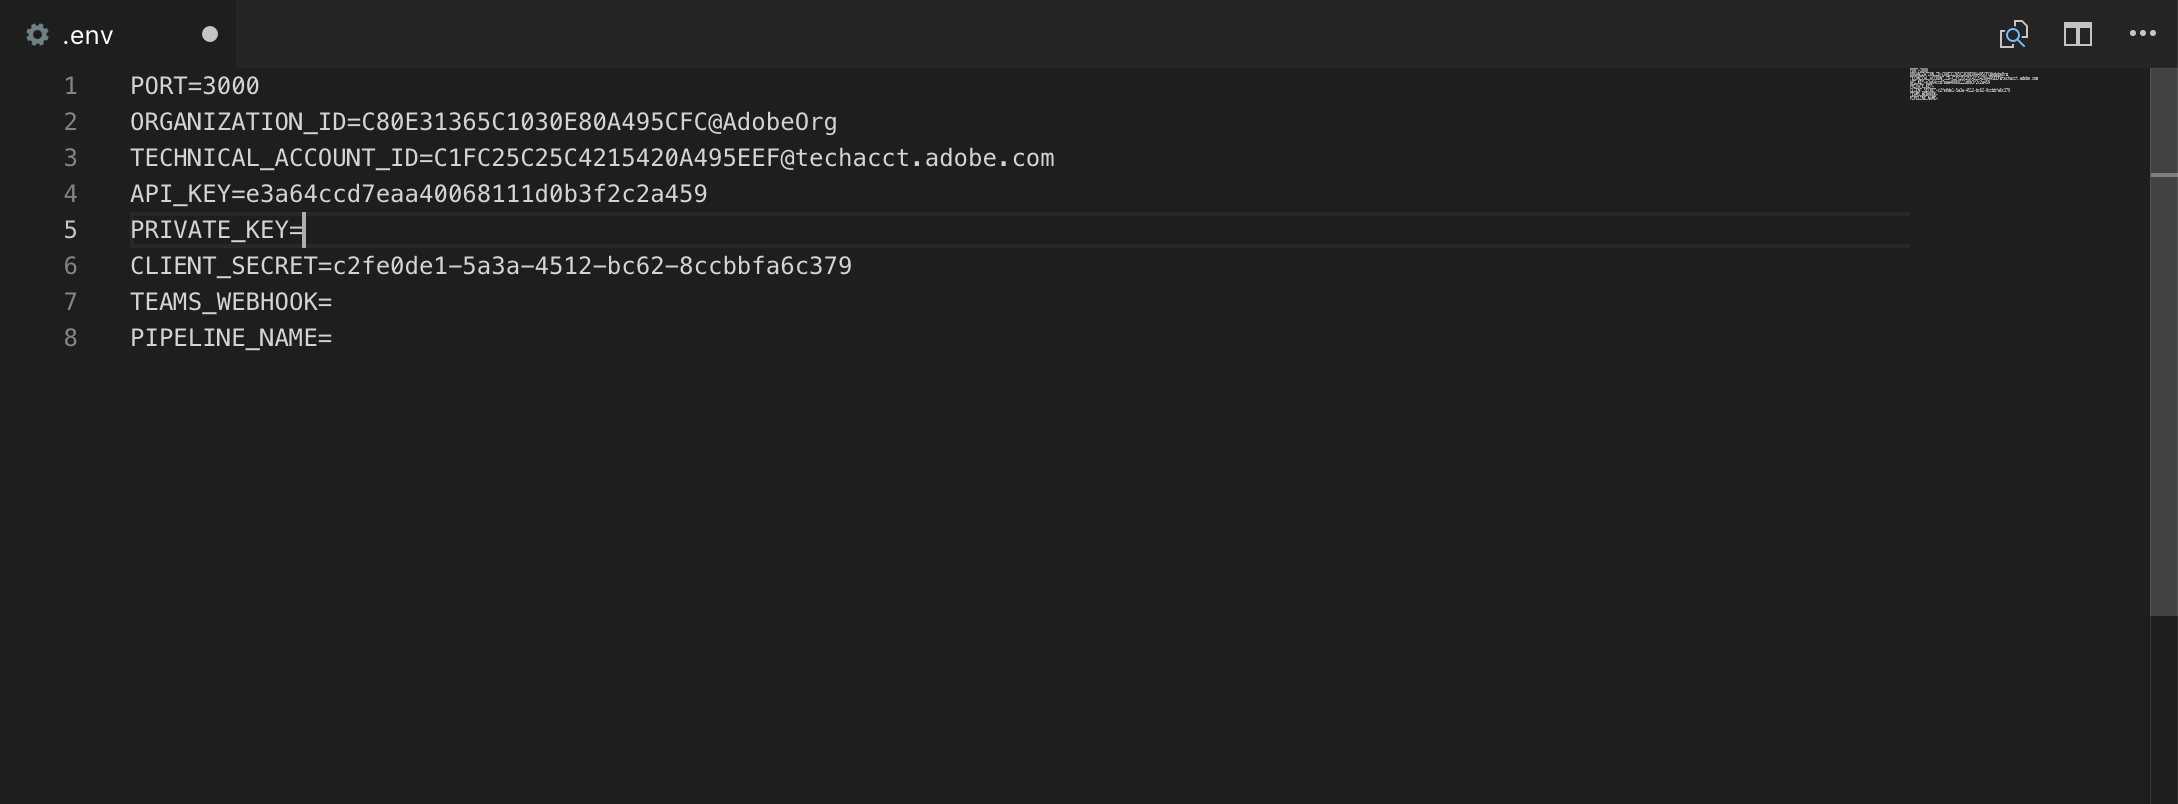
The PRIVATE_KEY variable needs to be set as the value of the generated private.key file but without any line breaks. There's a helper script which will do this for you. To run this and copy the result to the clipboard, in the terminal panel type:
npm run clean-private-key | pbcopy
Then you can paste this value into the .env file.
The next value we need is a webhook URL which will be used to post messages to Microsoft Teams.
This part is a bit complicated, but essentially Adobe I/O is going to invoke a webhook on your lab machine which in turn will invoke a webhook hosted by Microsoft.
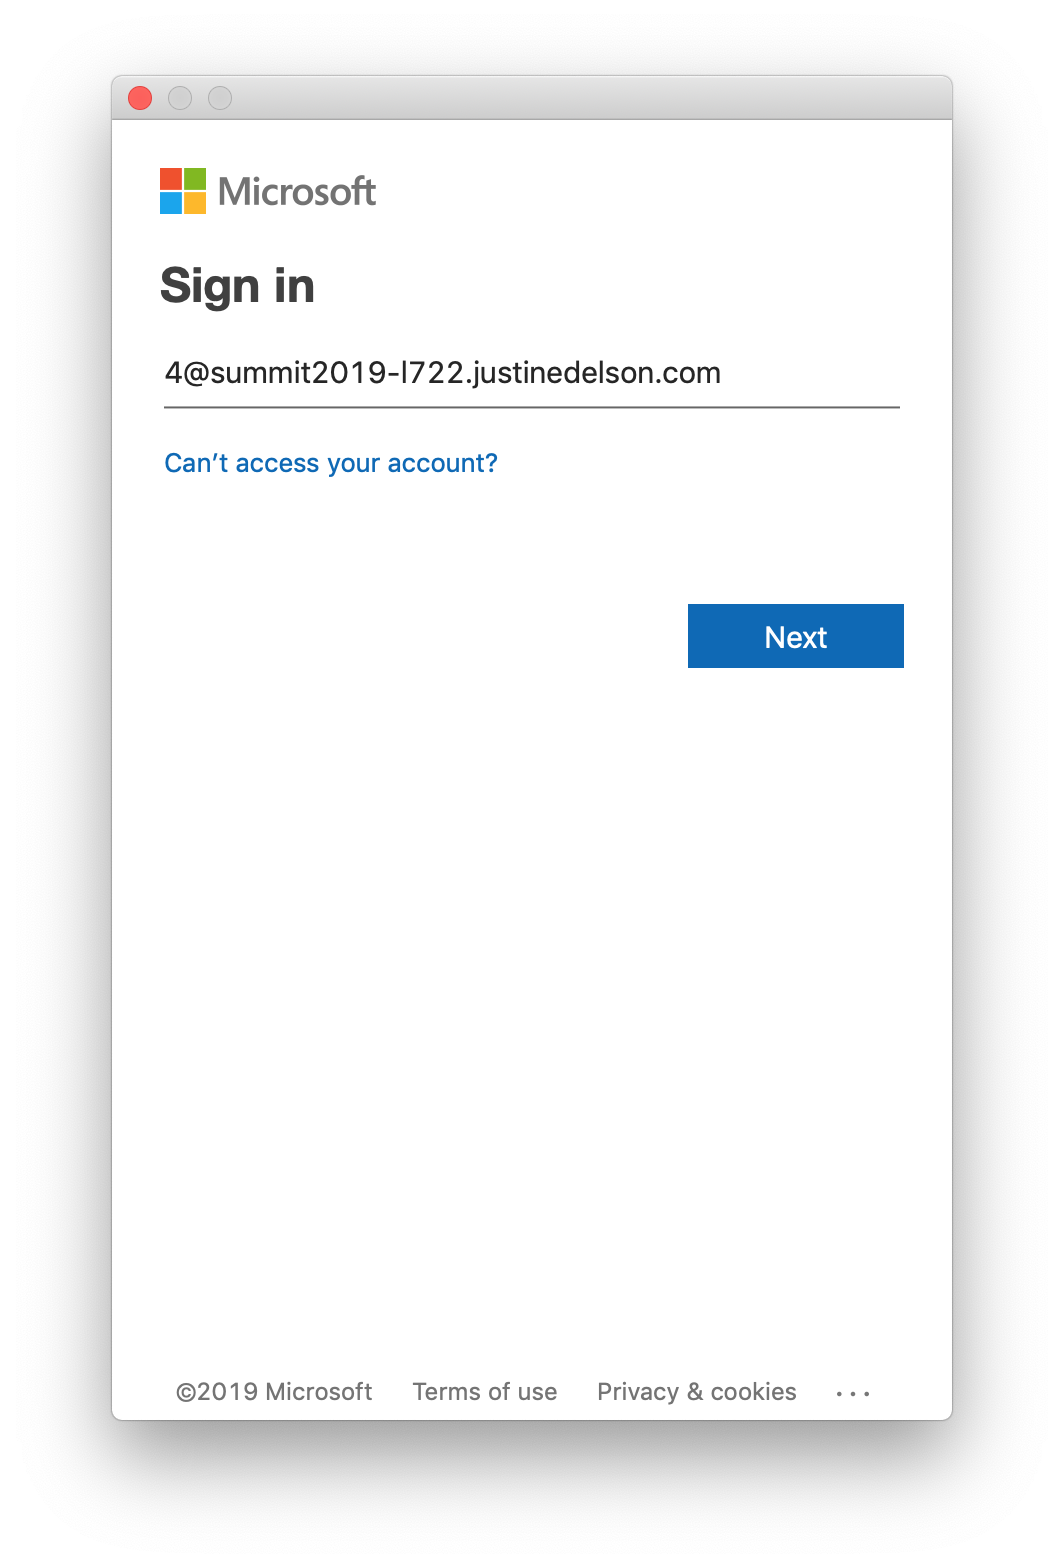
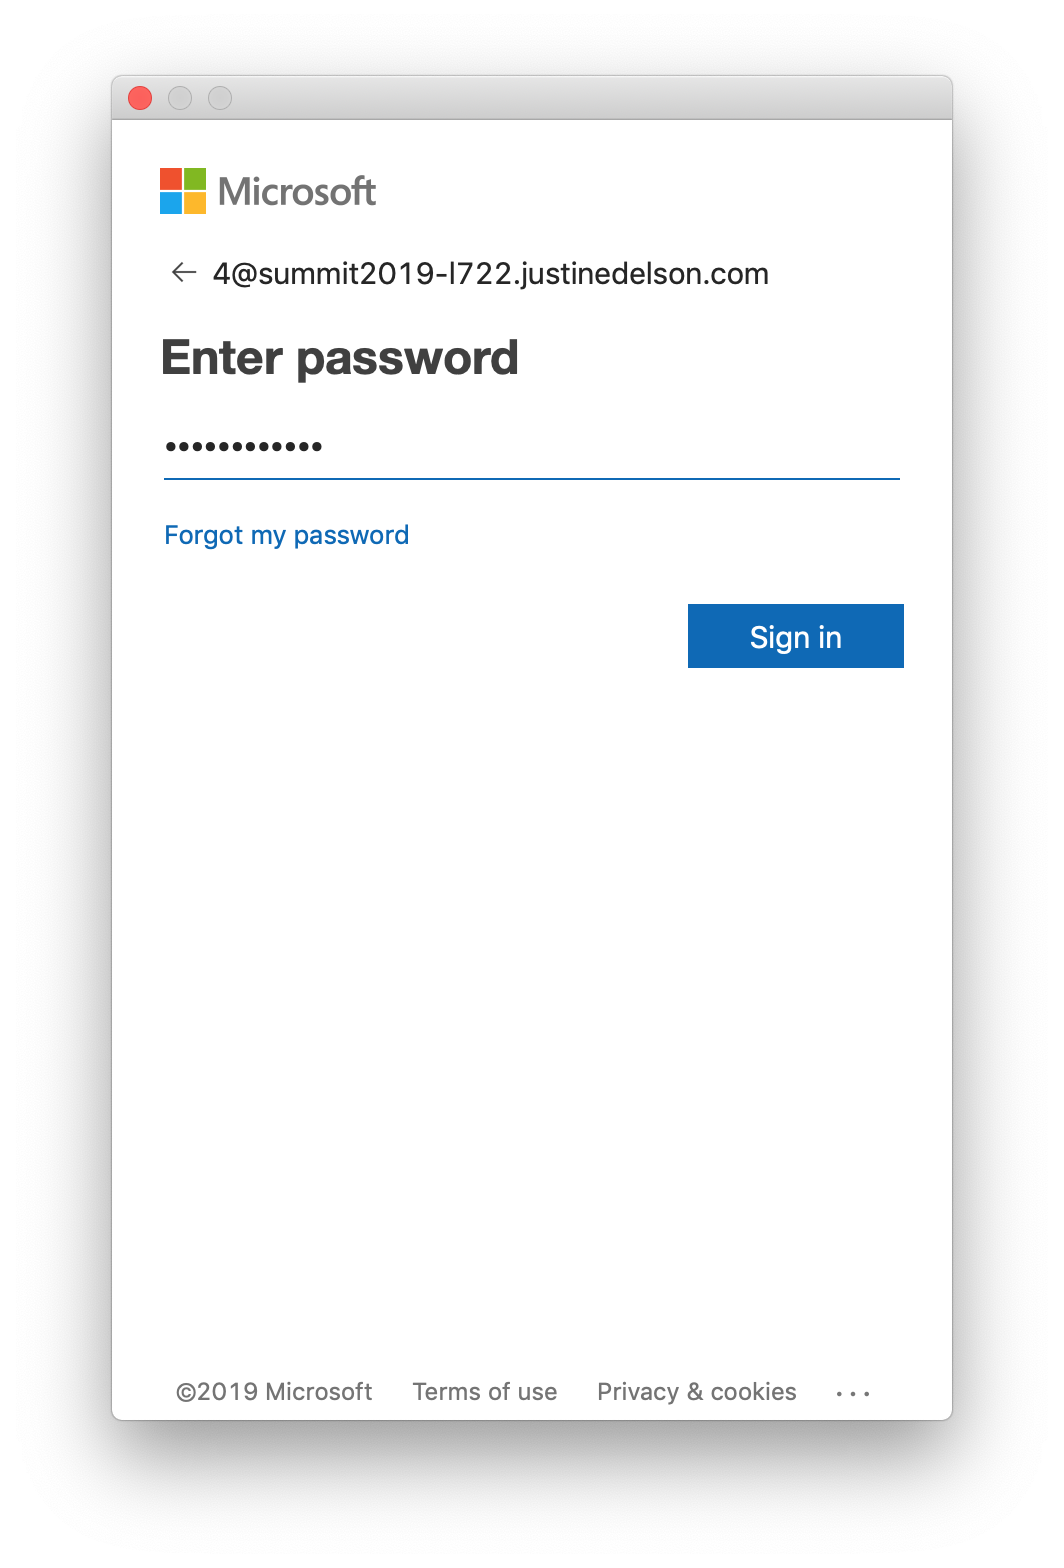
To start, open Microsoft Teams. When prompted to Sign-In, the email address is the last digit of your attendee ID @summit2019-l722.justinedelson.com. For example, if your attendee ID is 54, use the email address 4@summit2019-l722.justinedelson.com, if your attendee ID is 100, use the email address 0@summit2019-l722.justinedelson.com and so on. Click the Next button.
If you a prompted to select between a Work or school account and a Personal account, select Personal account. Your password can be found in a file named teams-credentials.txt on the Desktop. Enter it on the Enter password screen and click Sign in.
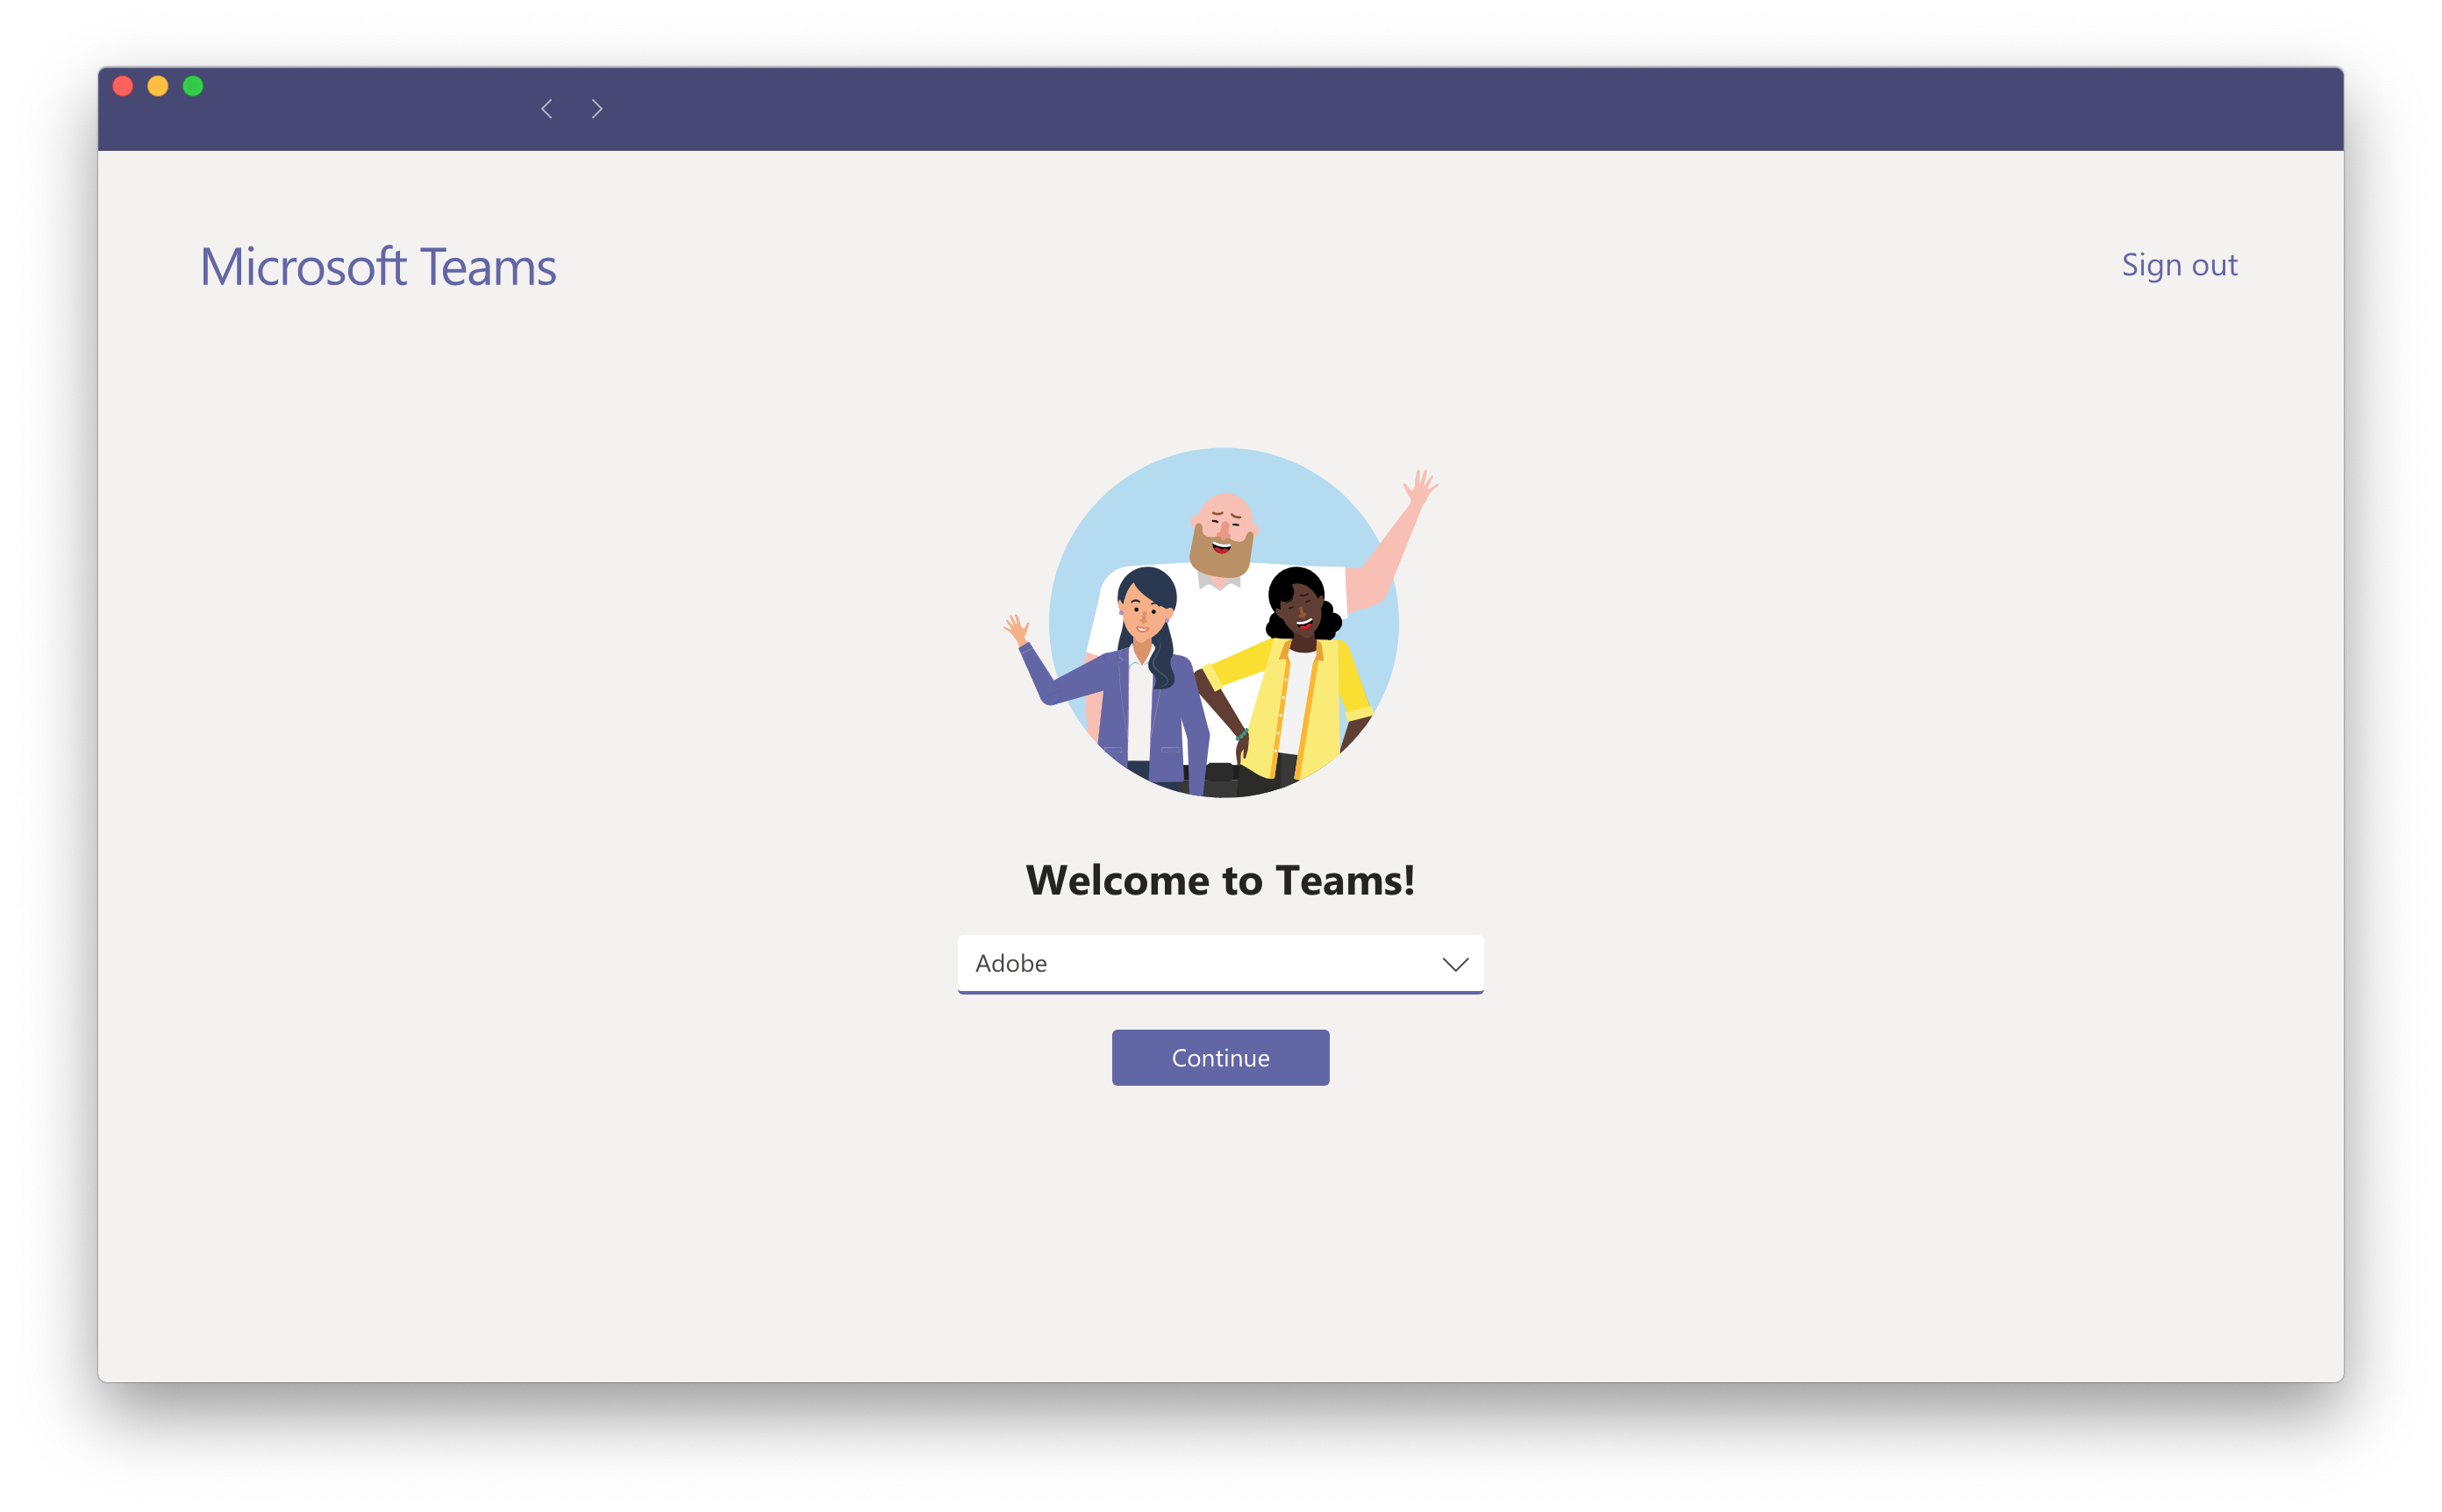
If you see the _Welcome to Teams! screen (see below), click the Continue button.
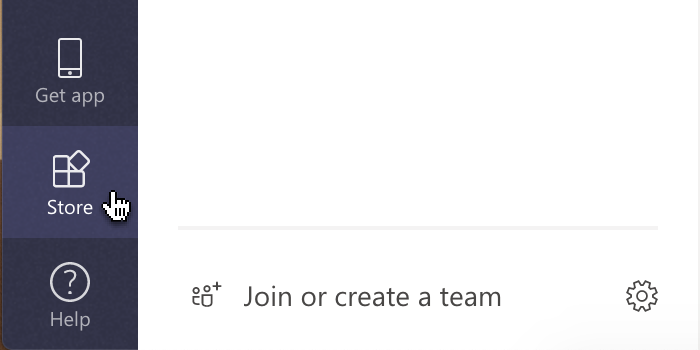
To create an Incoming Webhook integration, click the Store icon.
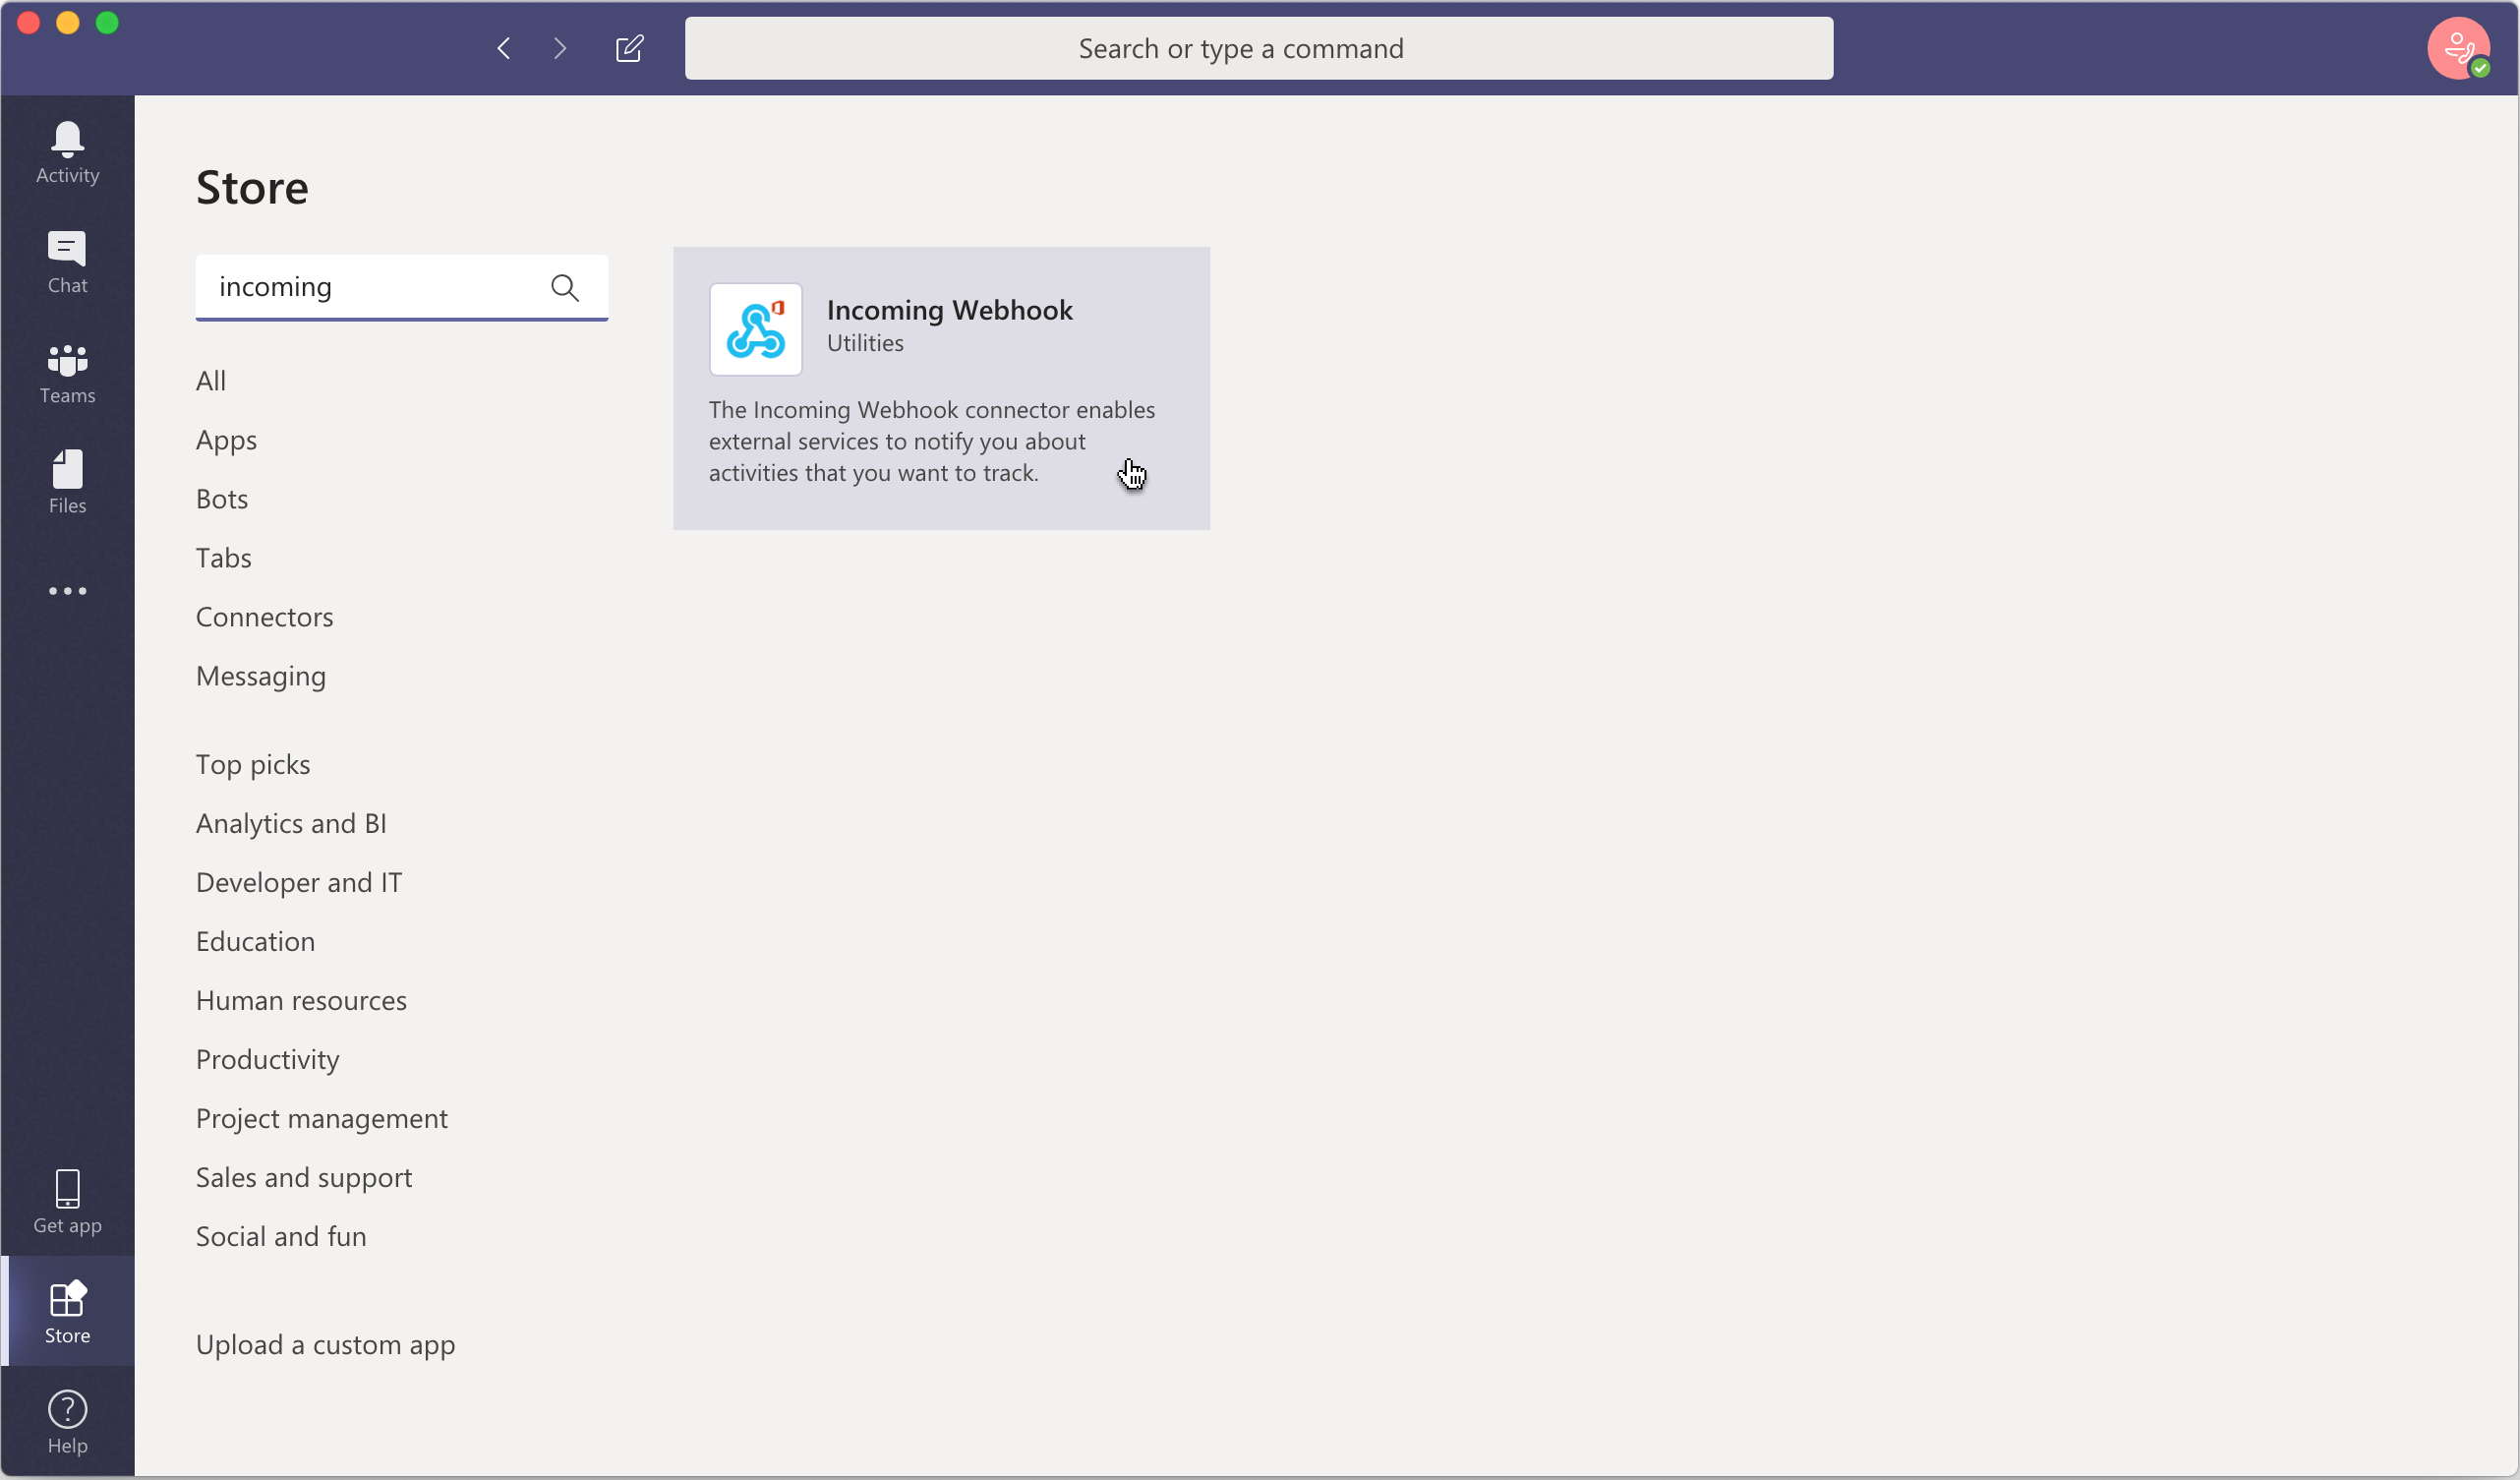
Search for incoming and click on Incoming Webhook.
Select Summit Lab 722 as the team. Since the connector is already installed, click the Available link.
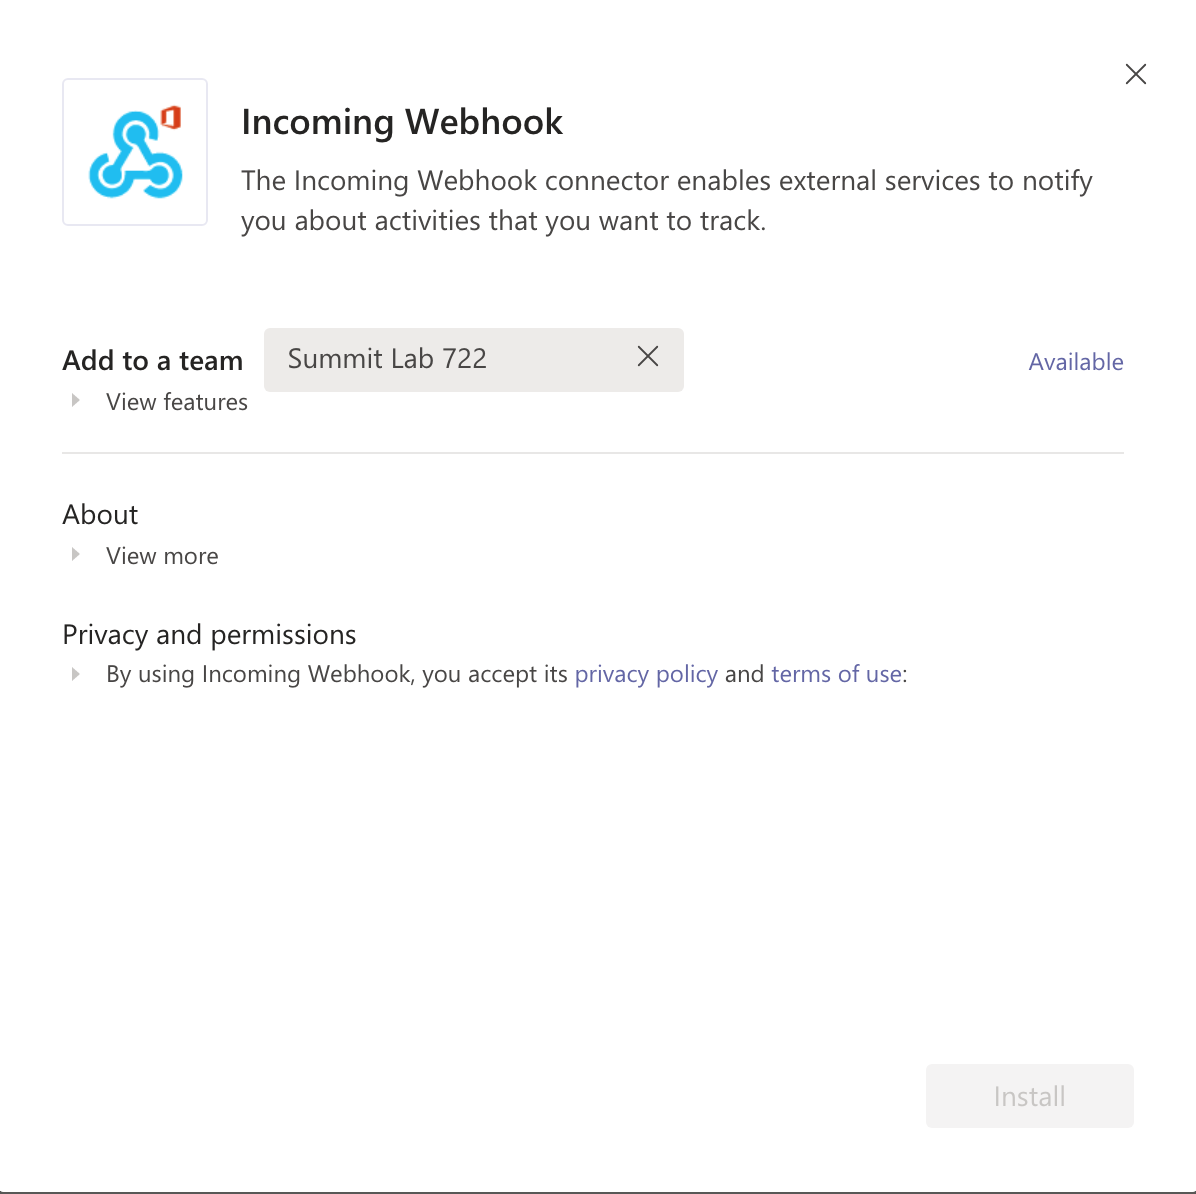
The webhook should send messages to the General channel by default. On the next screen, click Set up.
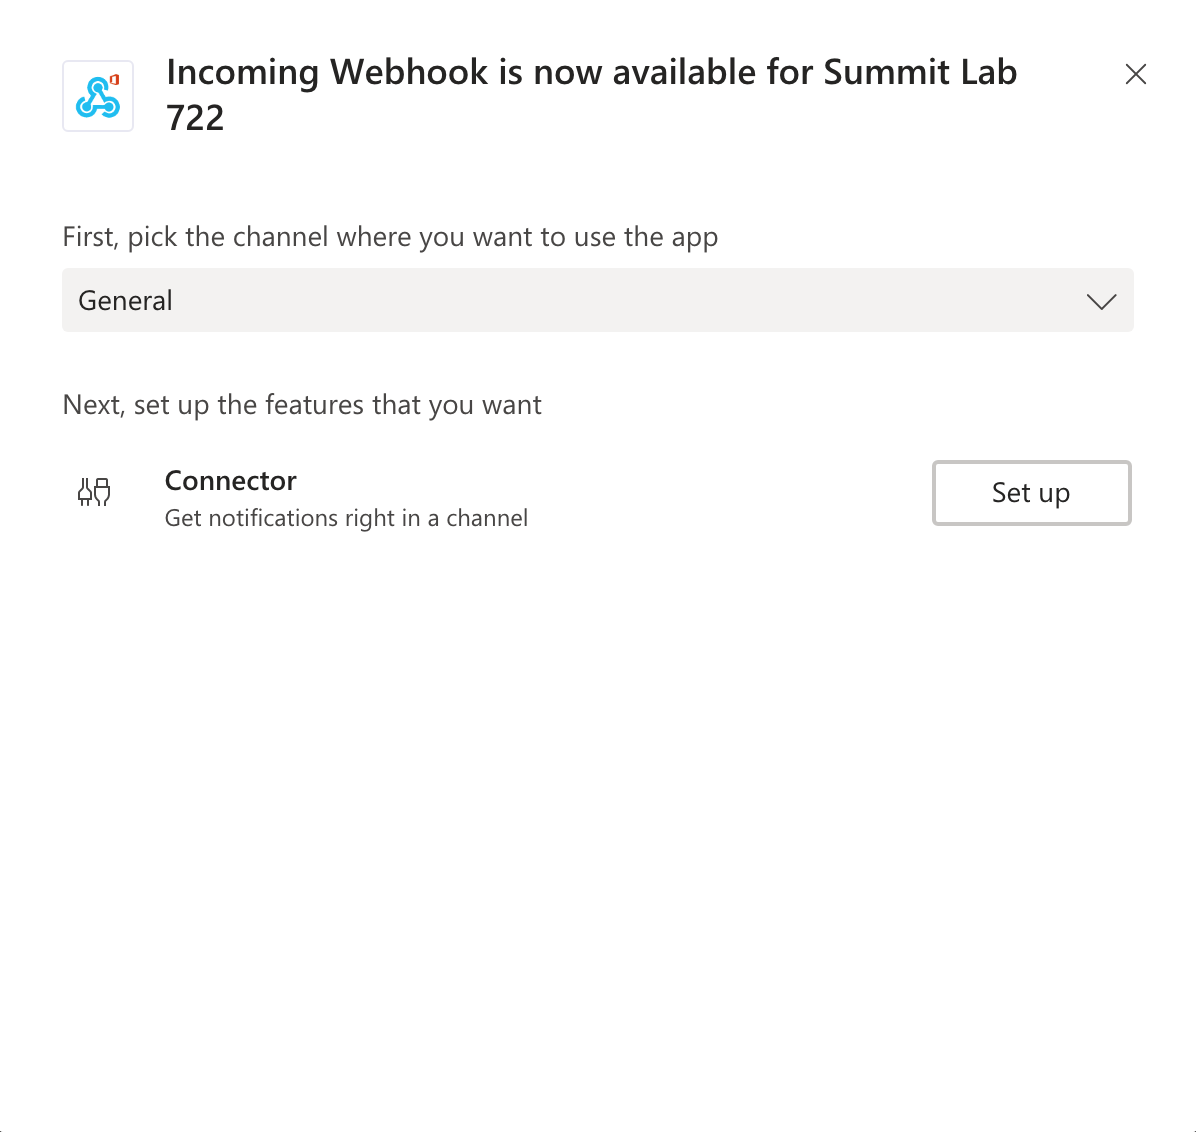
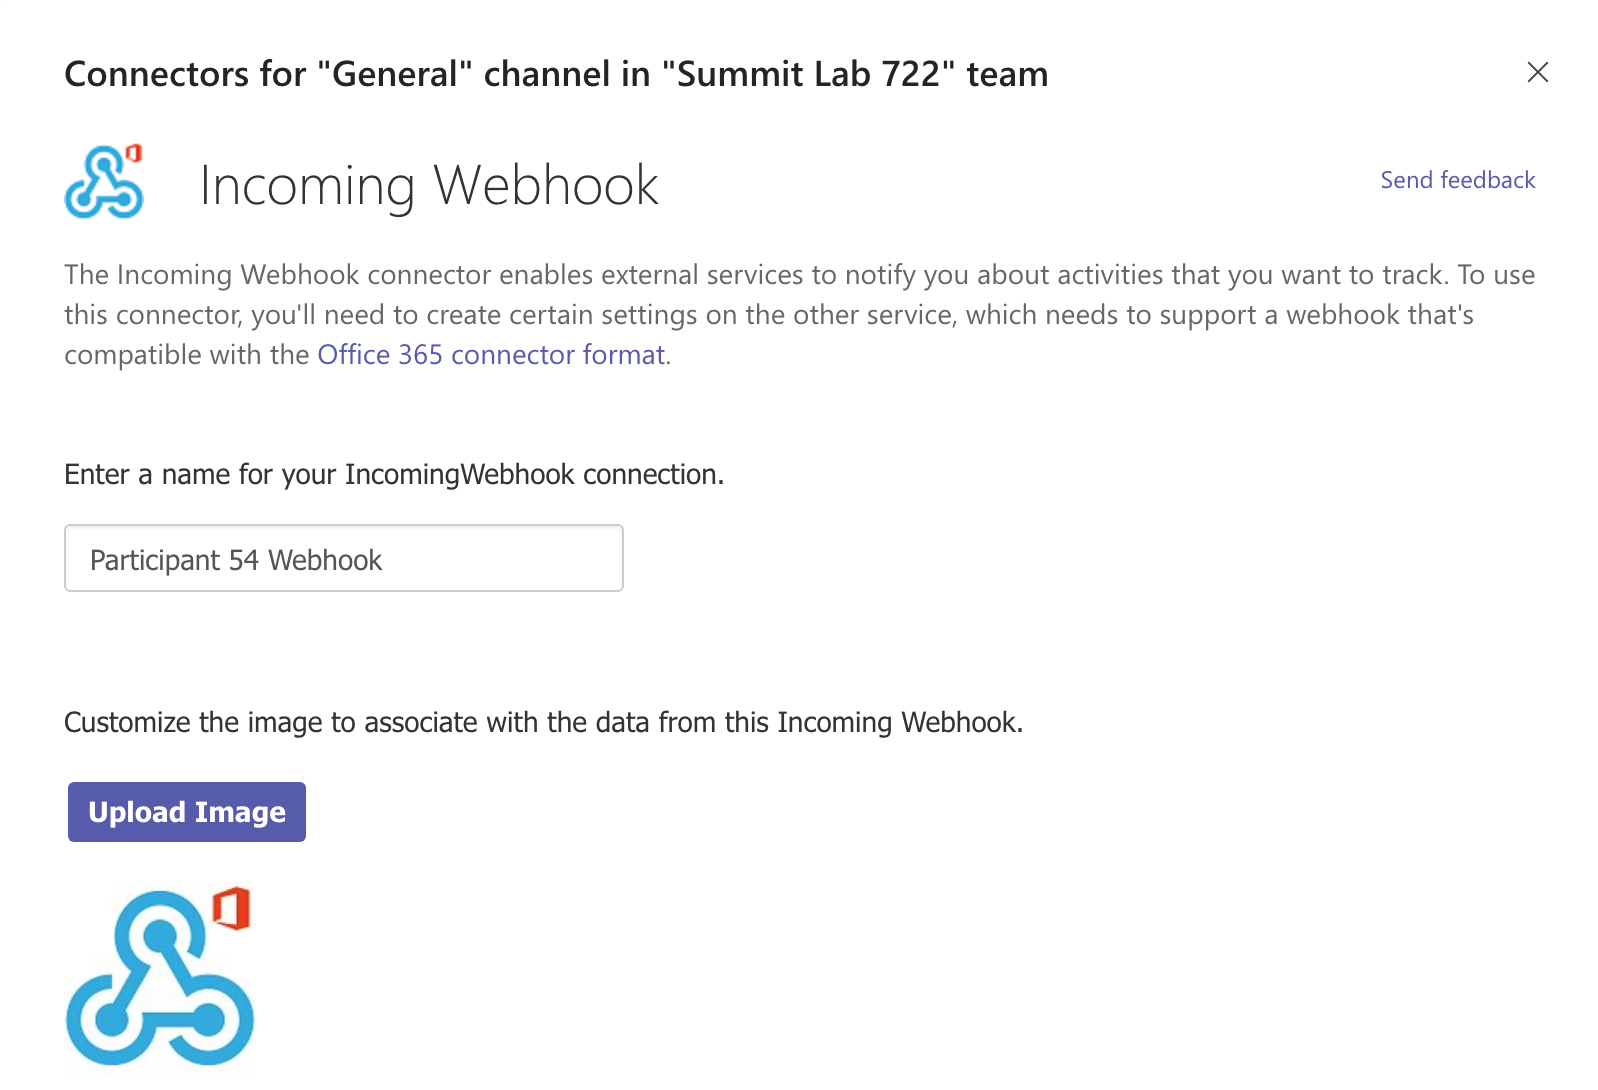
You need to provide a name for your webhook. Do this with a name based on your attendee number and click the Create button.
You will now see a URL (it will begin with https://outlook.office.com/webhook/). Click the button to copy this to the clipboard and click the Done button.
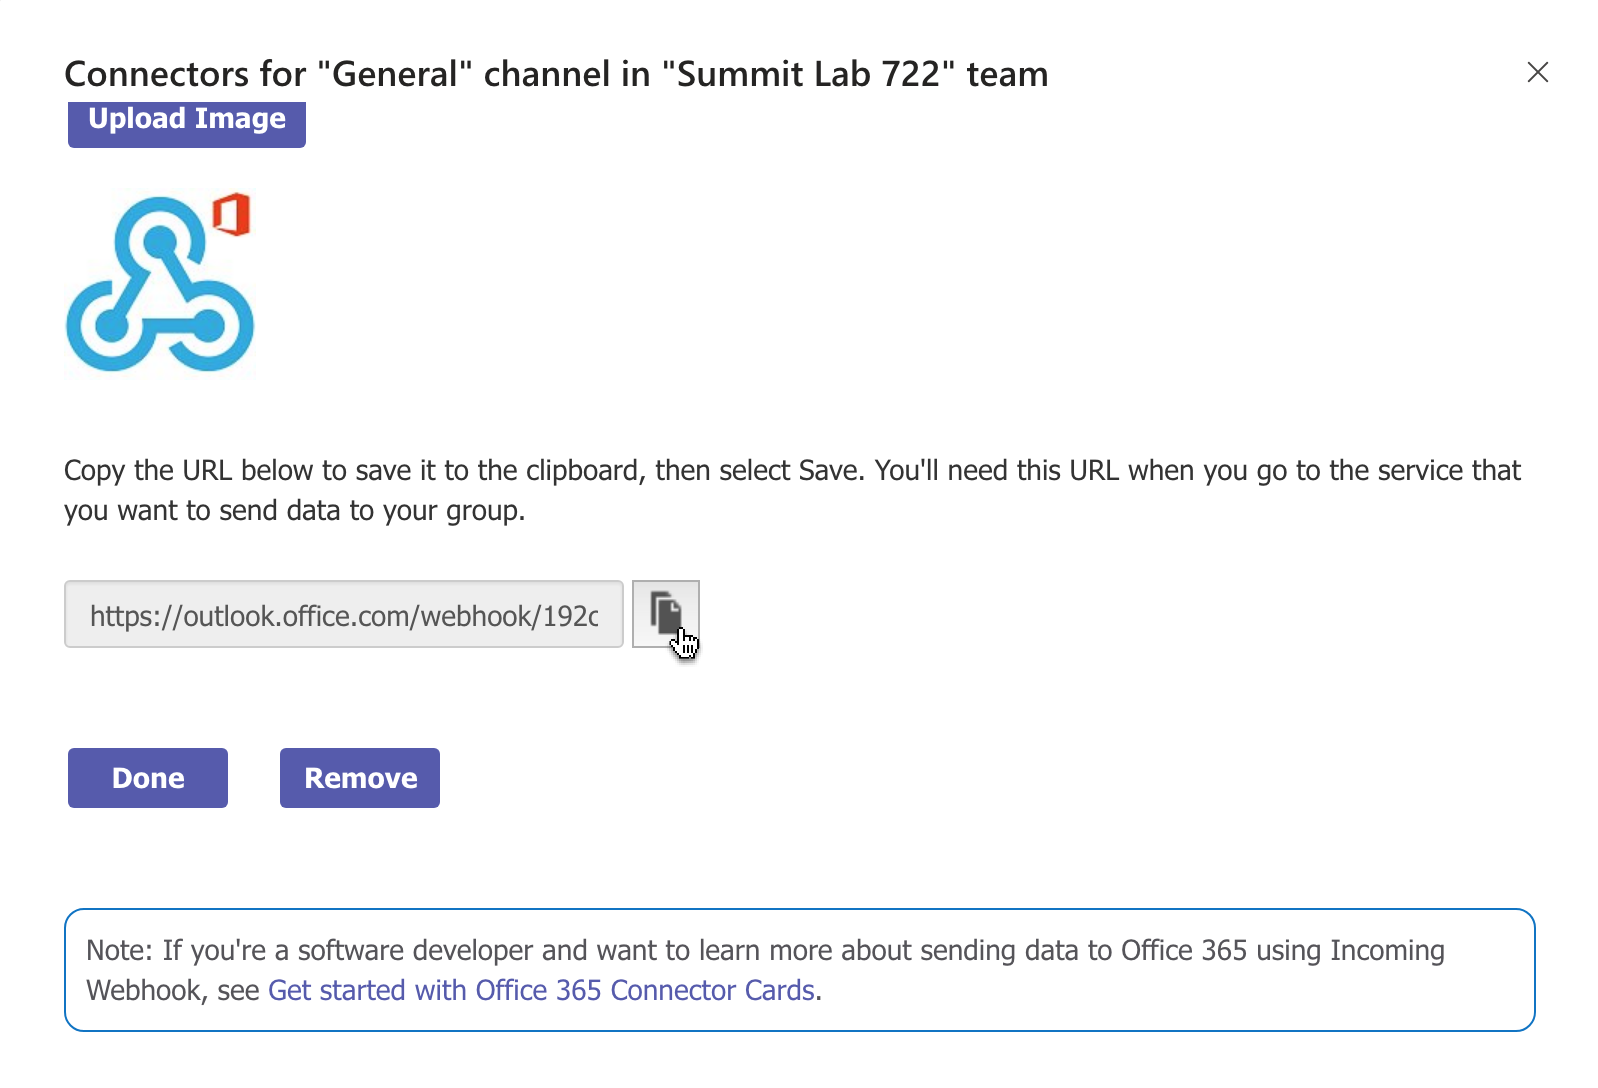
Now switch back to Visual Studio Code and paste the copied URL as the value of the TEAMS_WEBHOOK variable in the .env file.
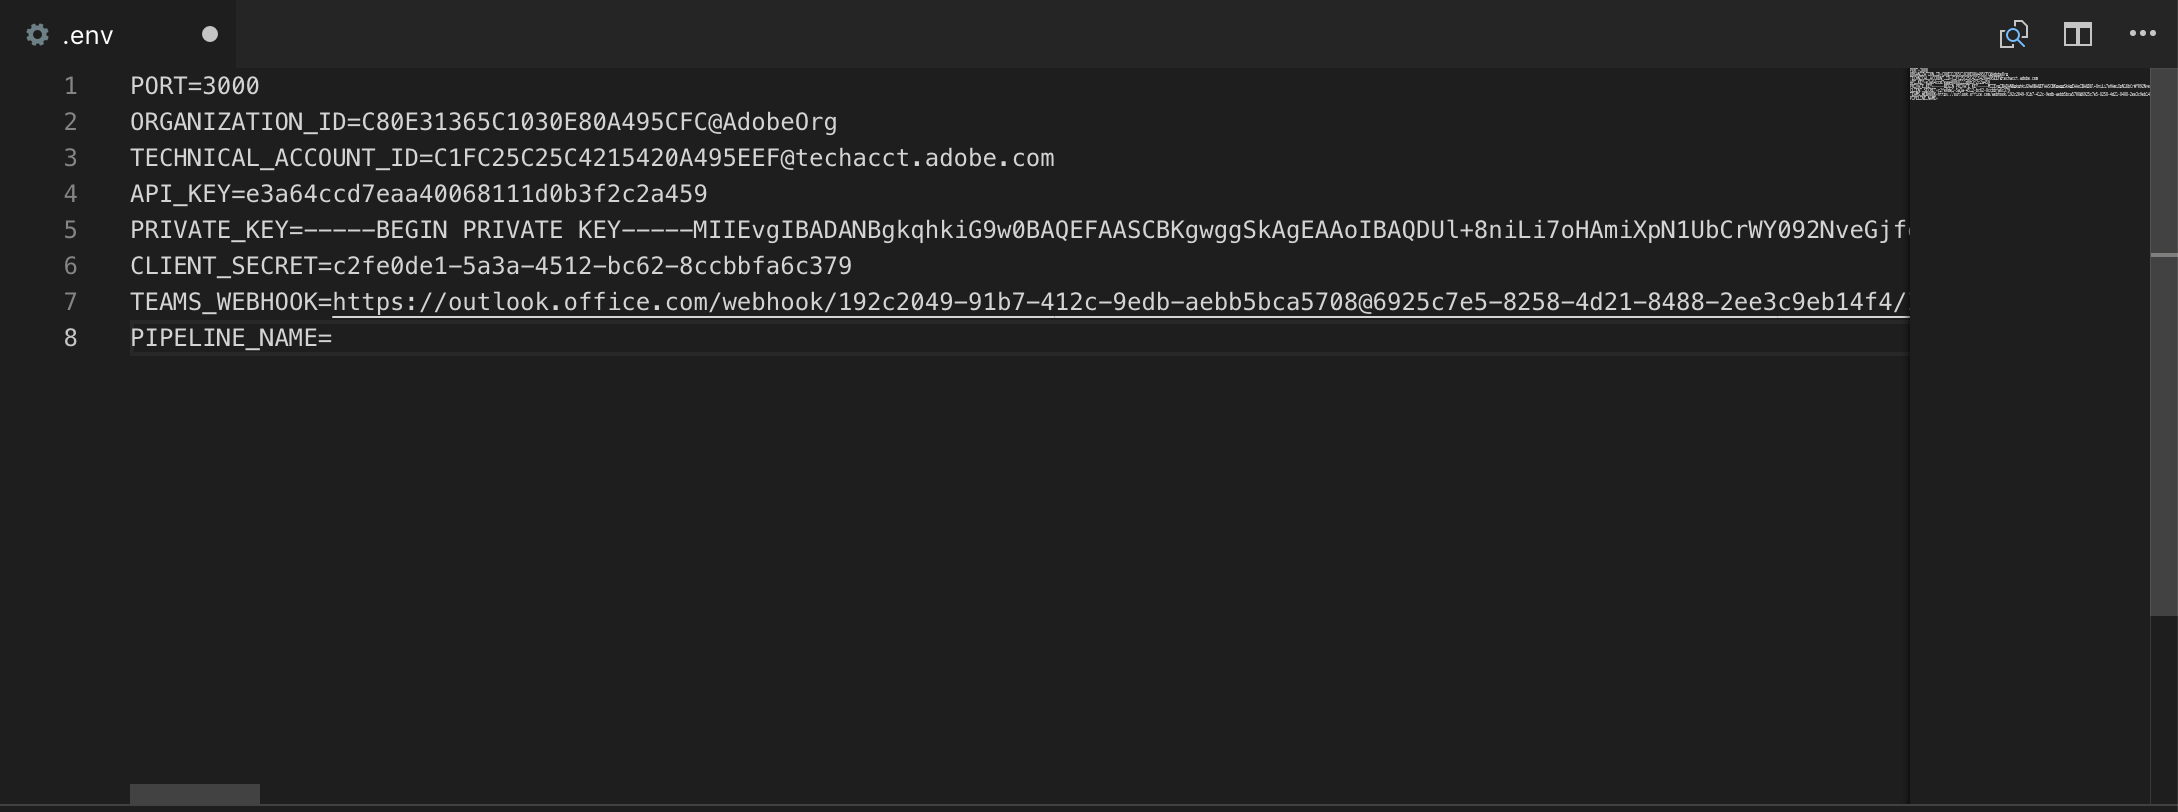
The last value which needs to be populated in the .env file is the name of the pipeline you created in Lesson 1. After adding this, make sure save the file in Visual Studio Code.
With our webhook fully configured, we can start it and register it with Adobe I/O.
In order to register a webhook with Adobe I/O, it must be running and, as mentioned in Lesson 4, accessible from the public internet.
To start the webhook, in the terminal panel in Visual Studio Code run
npm start
Switch back to Chrome (you should still be on the Integration Details page in the Adobe I/O Console) and click the Events tab.
Under the Add New Event Providers section, select Cloud Manager and click the Add event provider button.
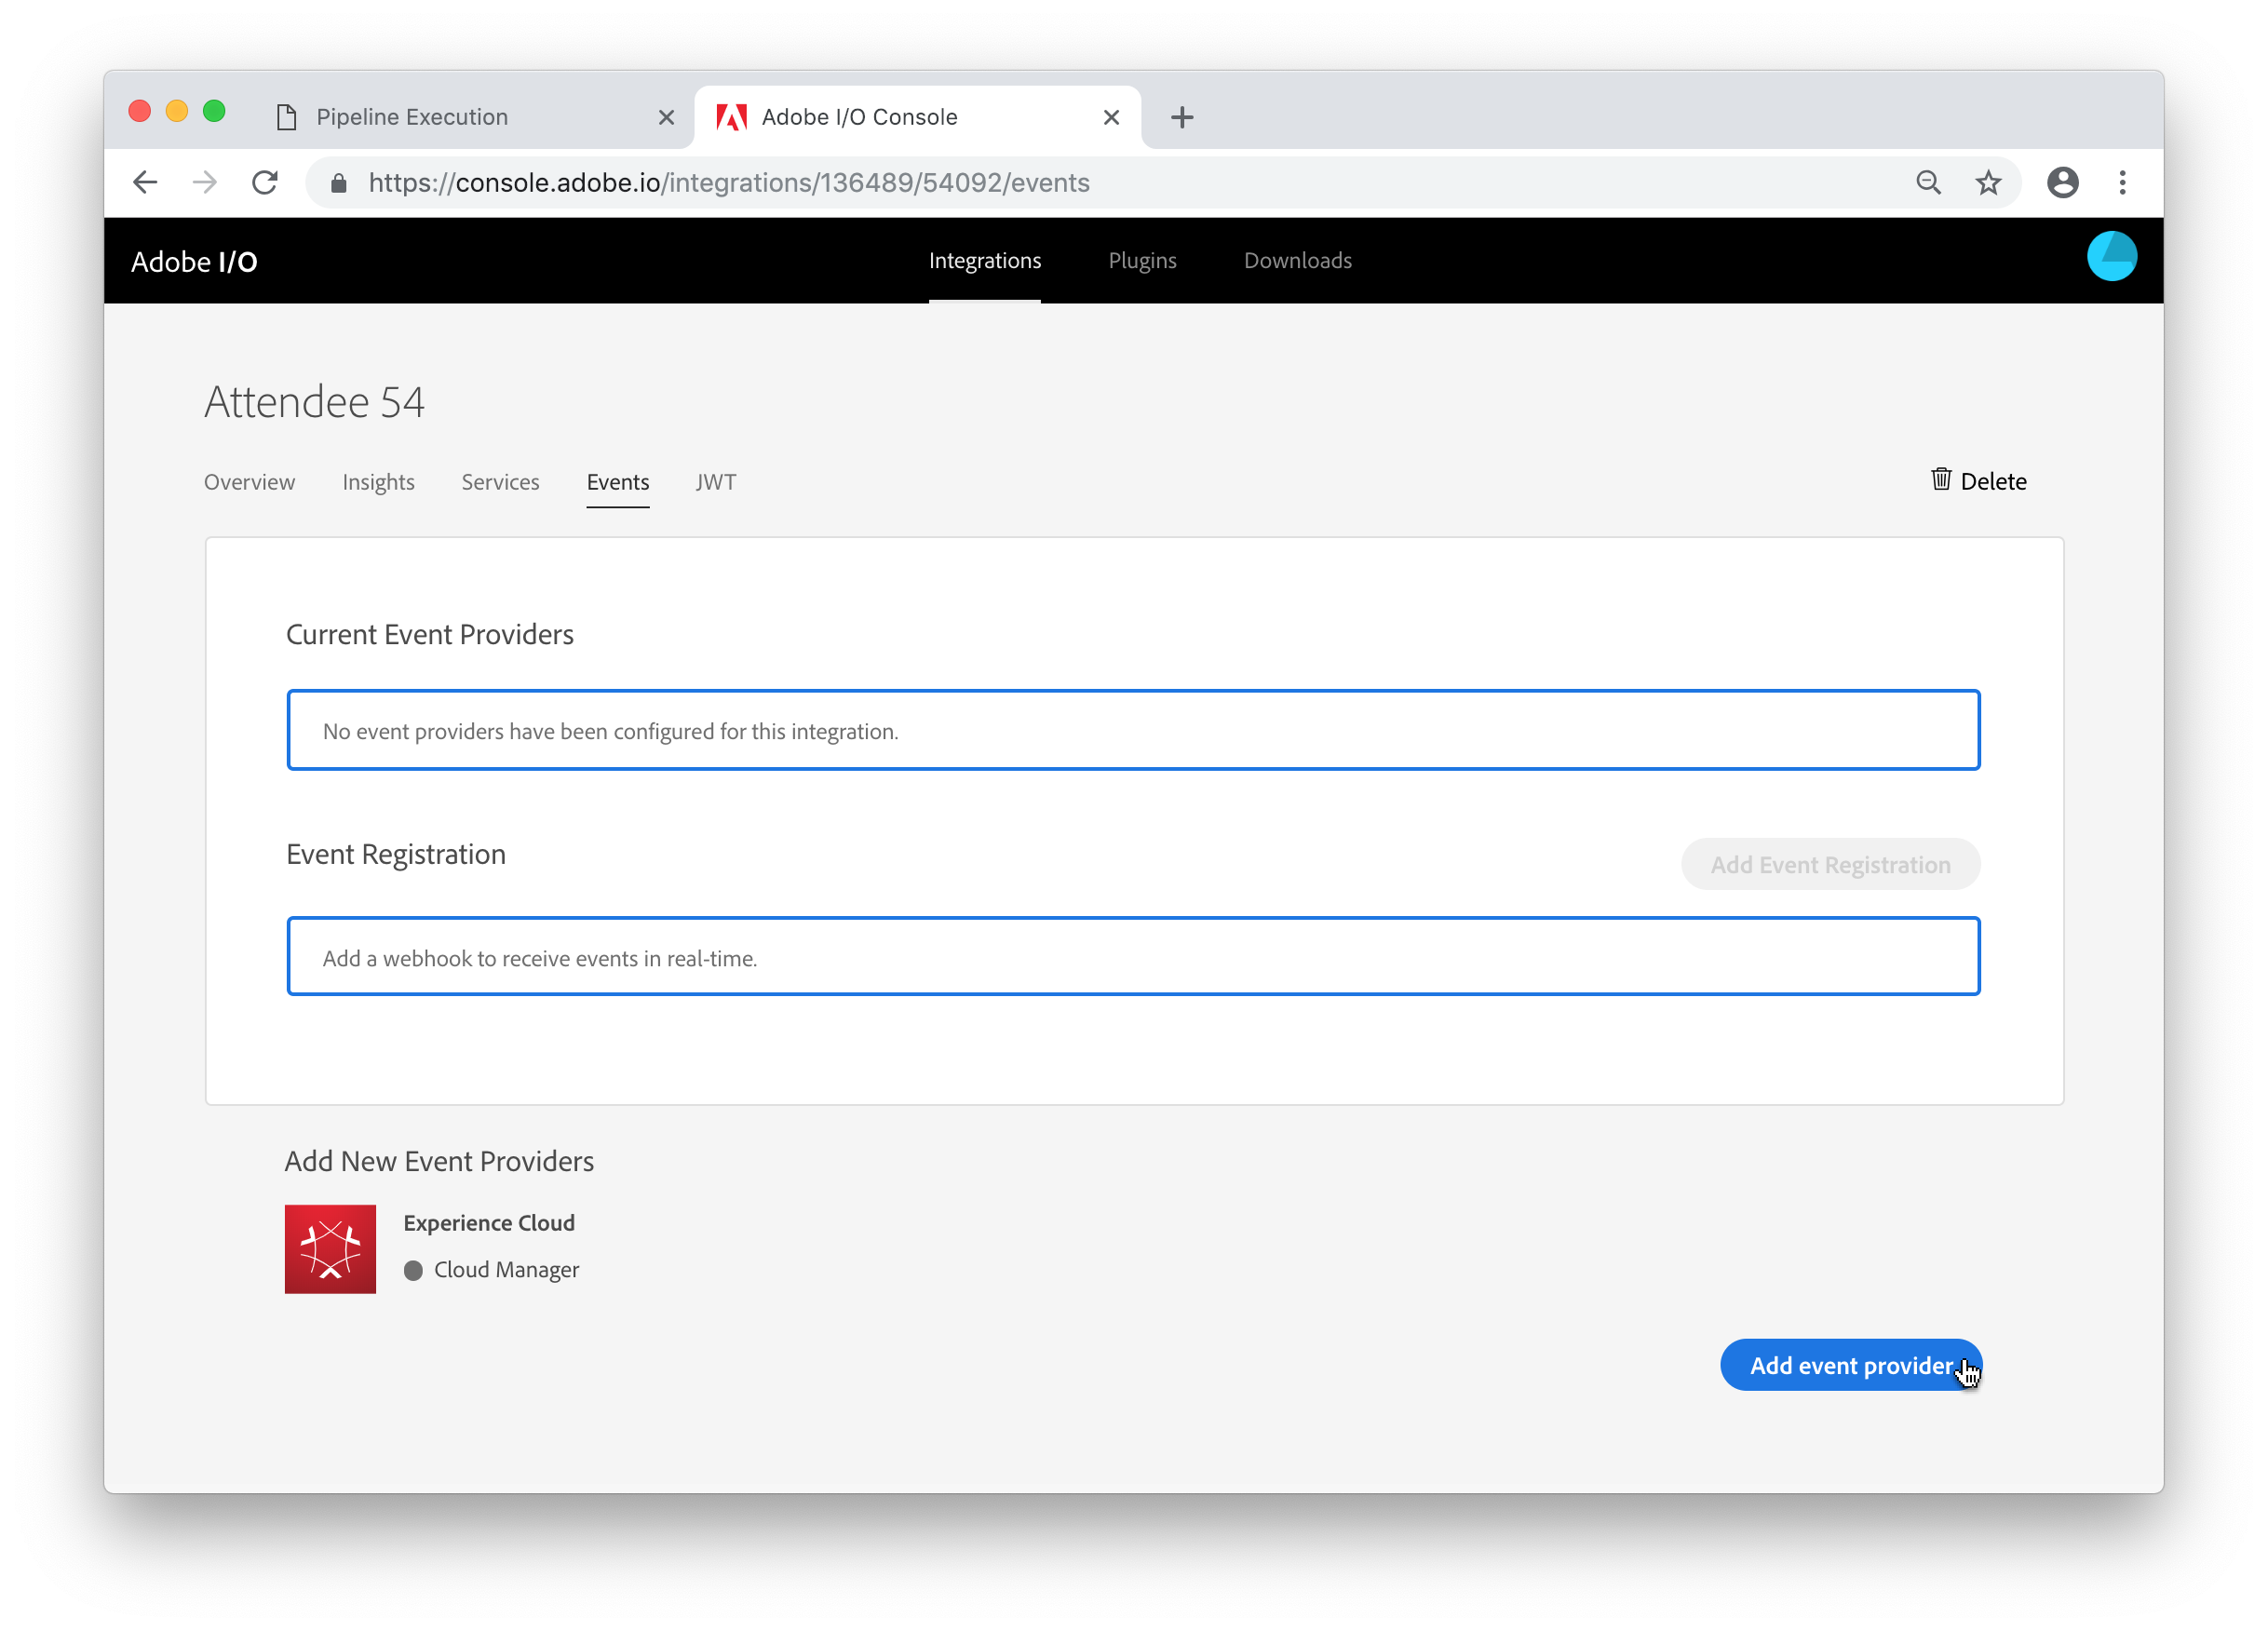
Then click the Add Event Registration button.
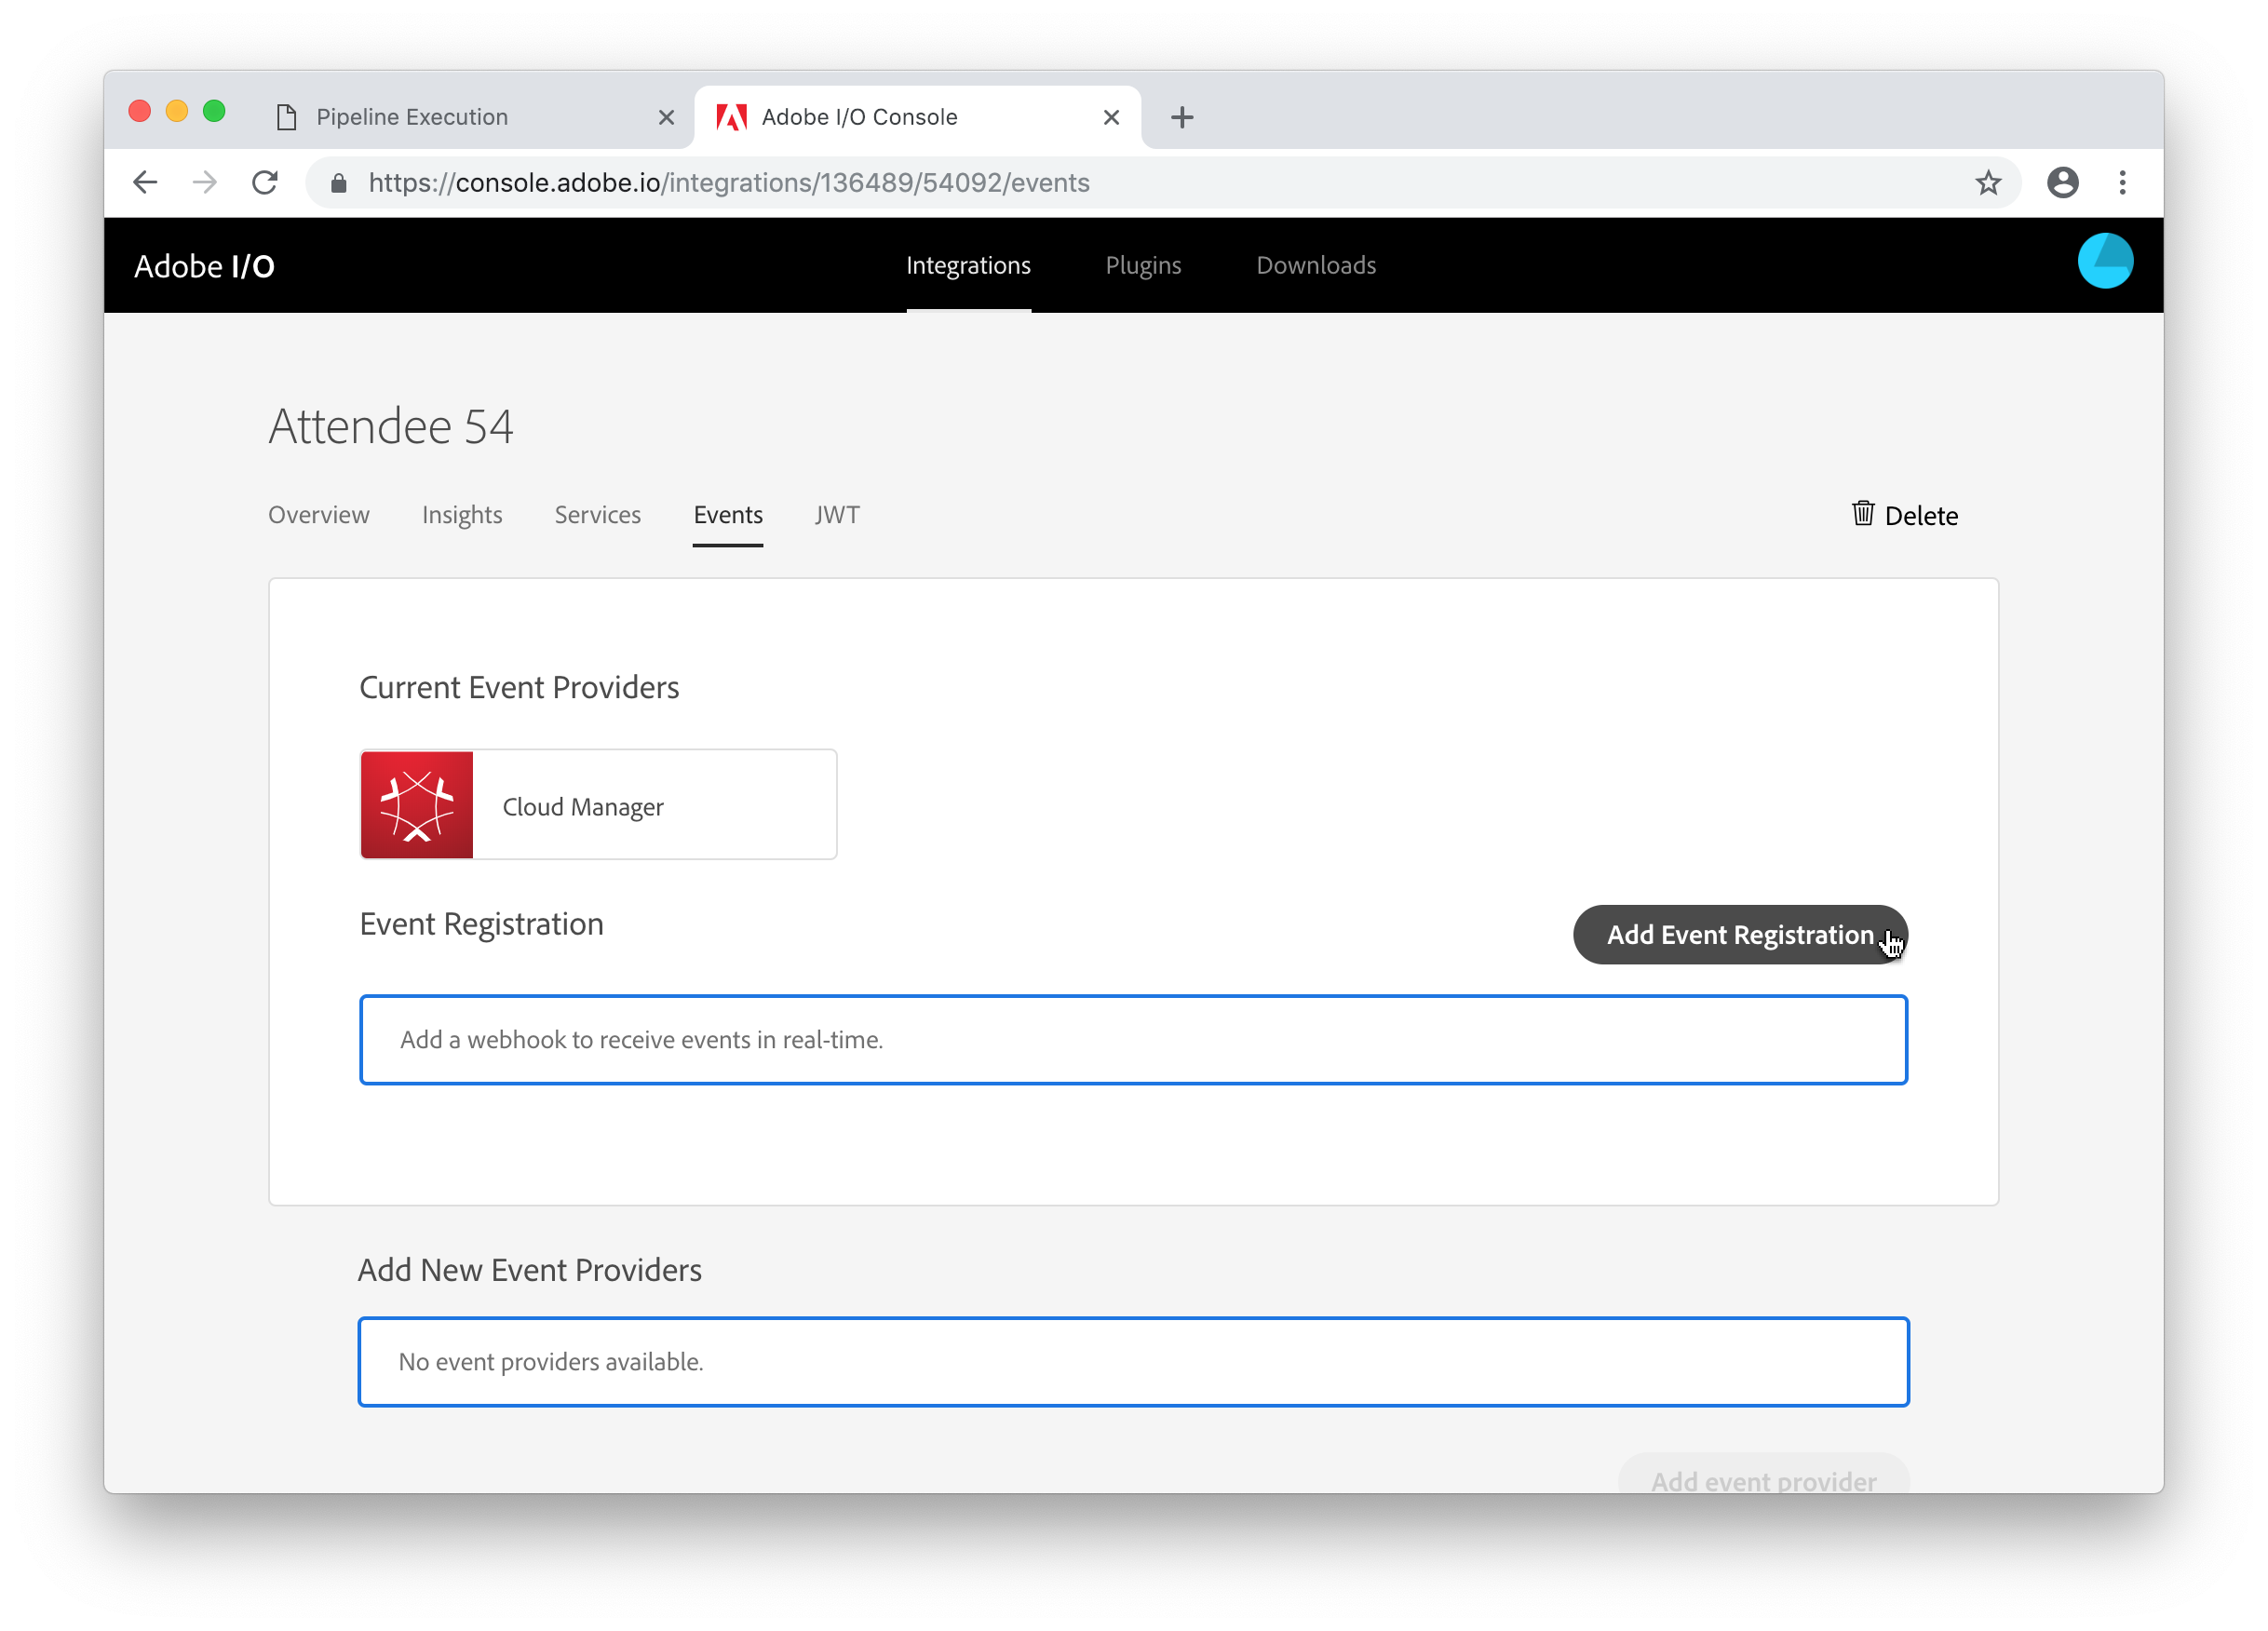
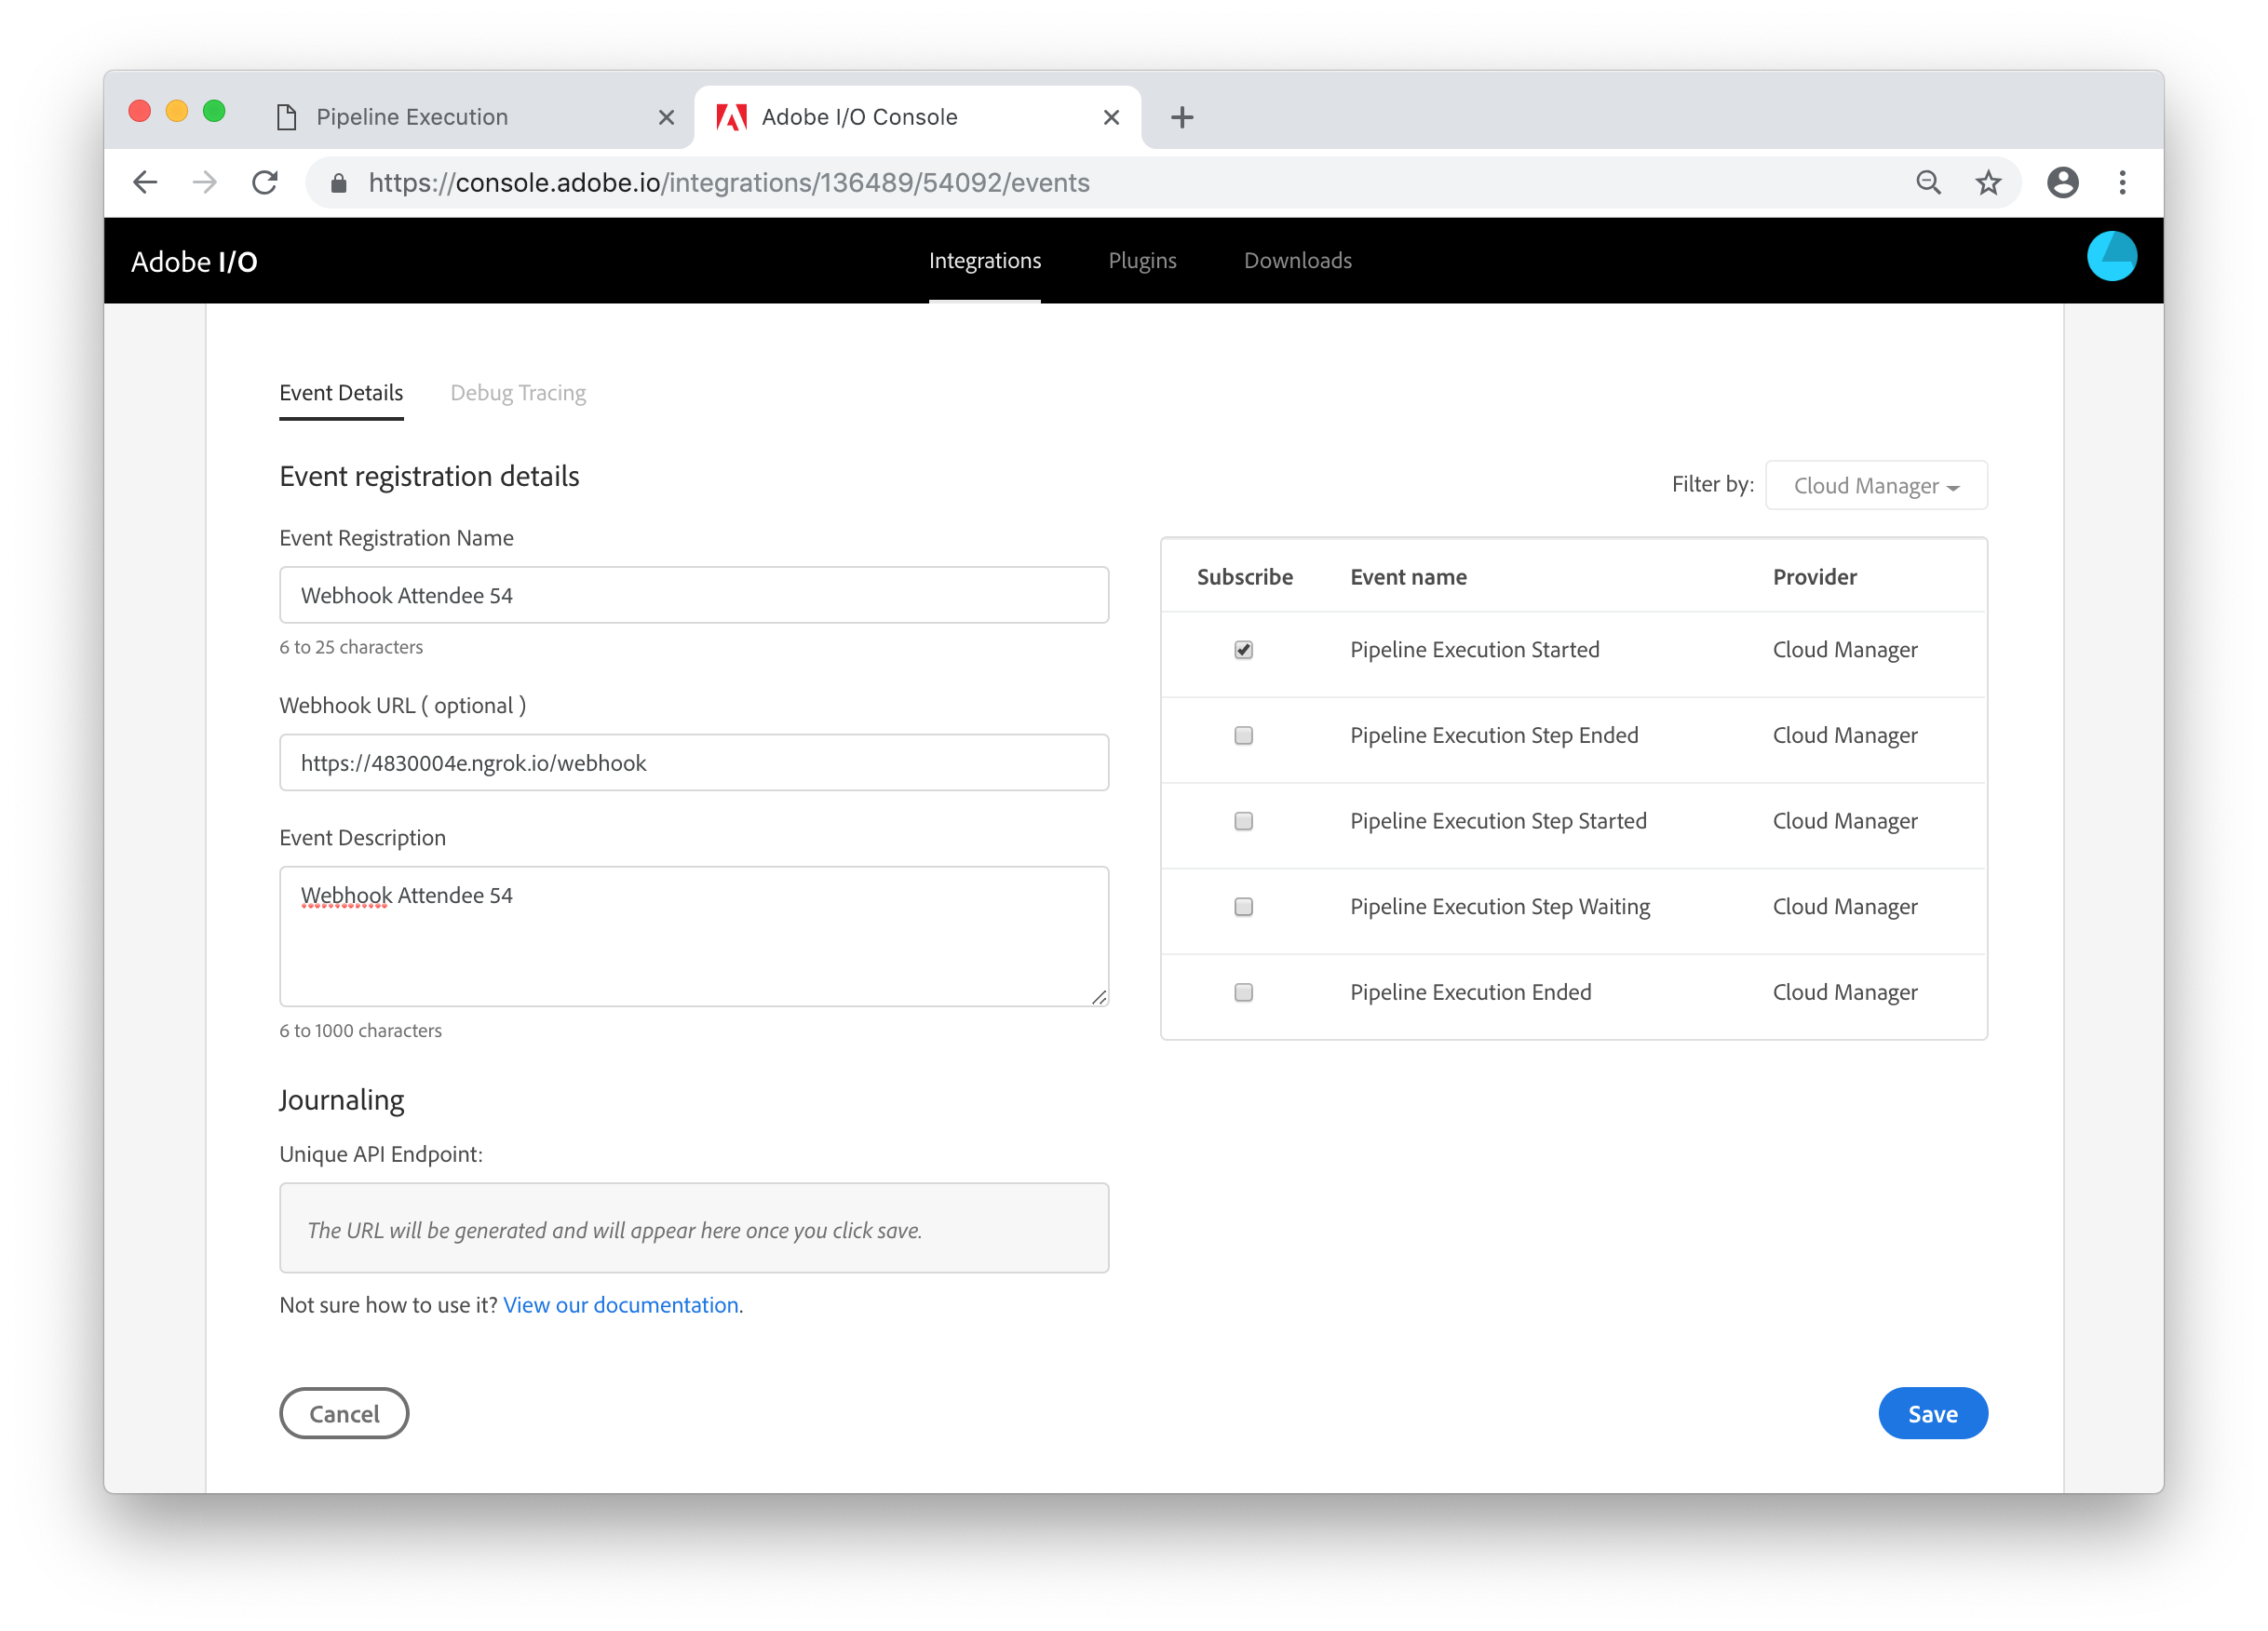
Provide a name and description for your webhook and as the URL, use the ngrok-generated URL plus /webhook, e.g. if ngrok displayed https://4830004e.ngrok.io, the webhook URL is https://4830004e.ngrok.io/webhook. Adobe I/O registrations can receive multiple types of events (even multiple types of events from different providers). For the purpose of this lab, we only need to subscribe to the Pipeline Execution Started event. Click the checkbox next to this event. Then click the Save button.
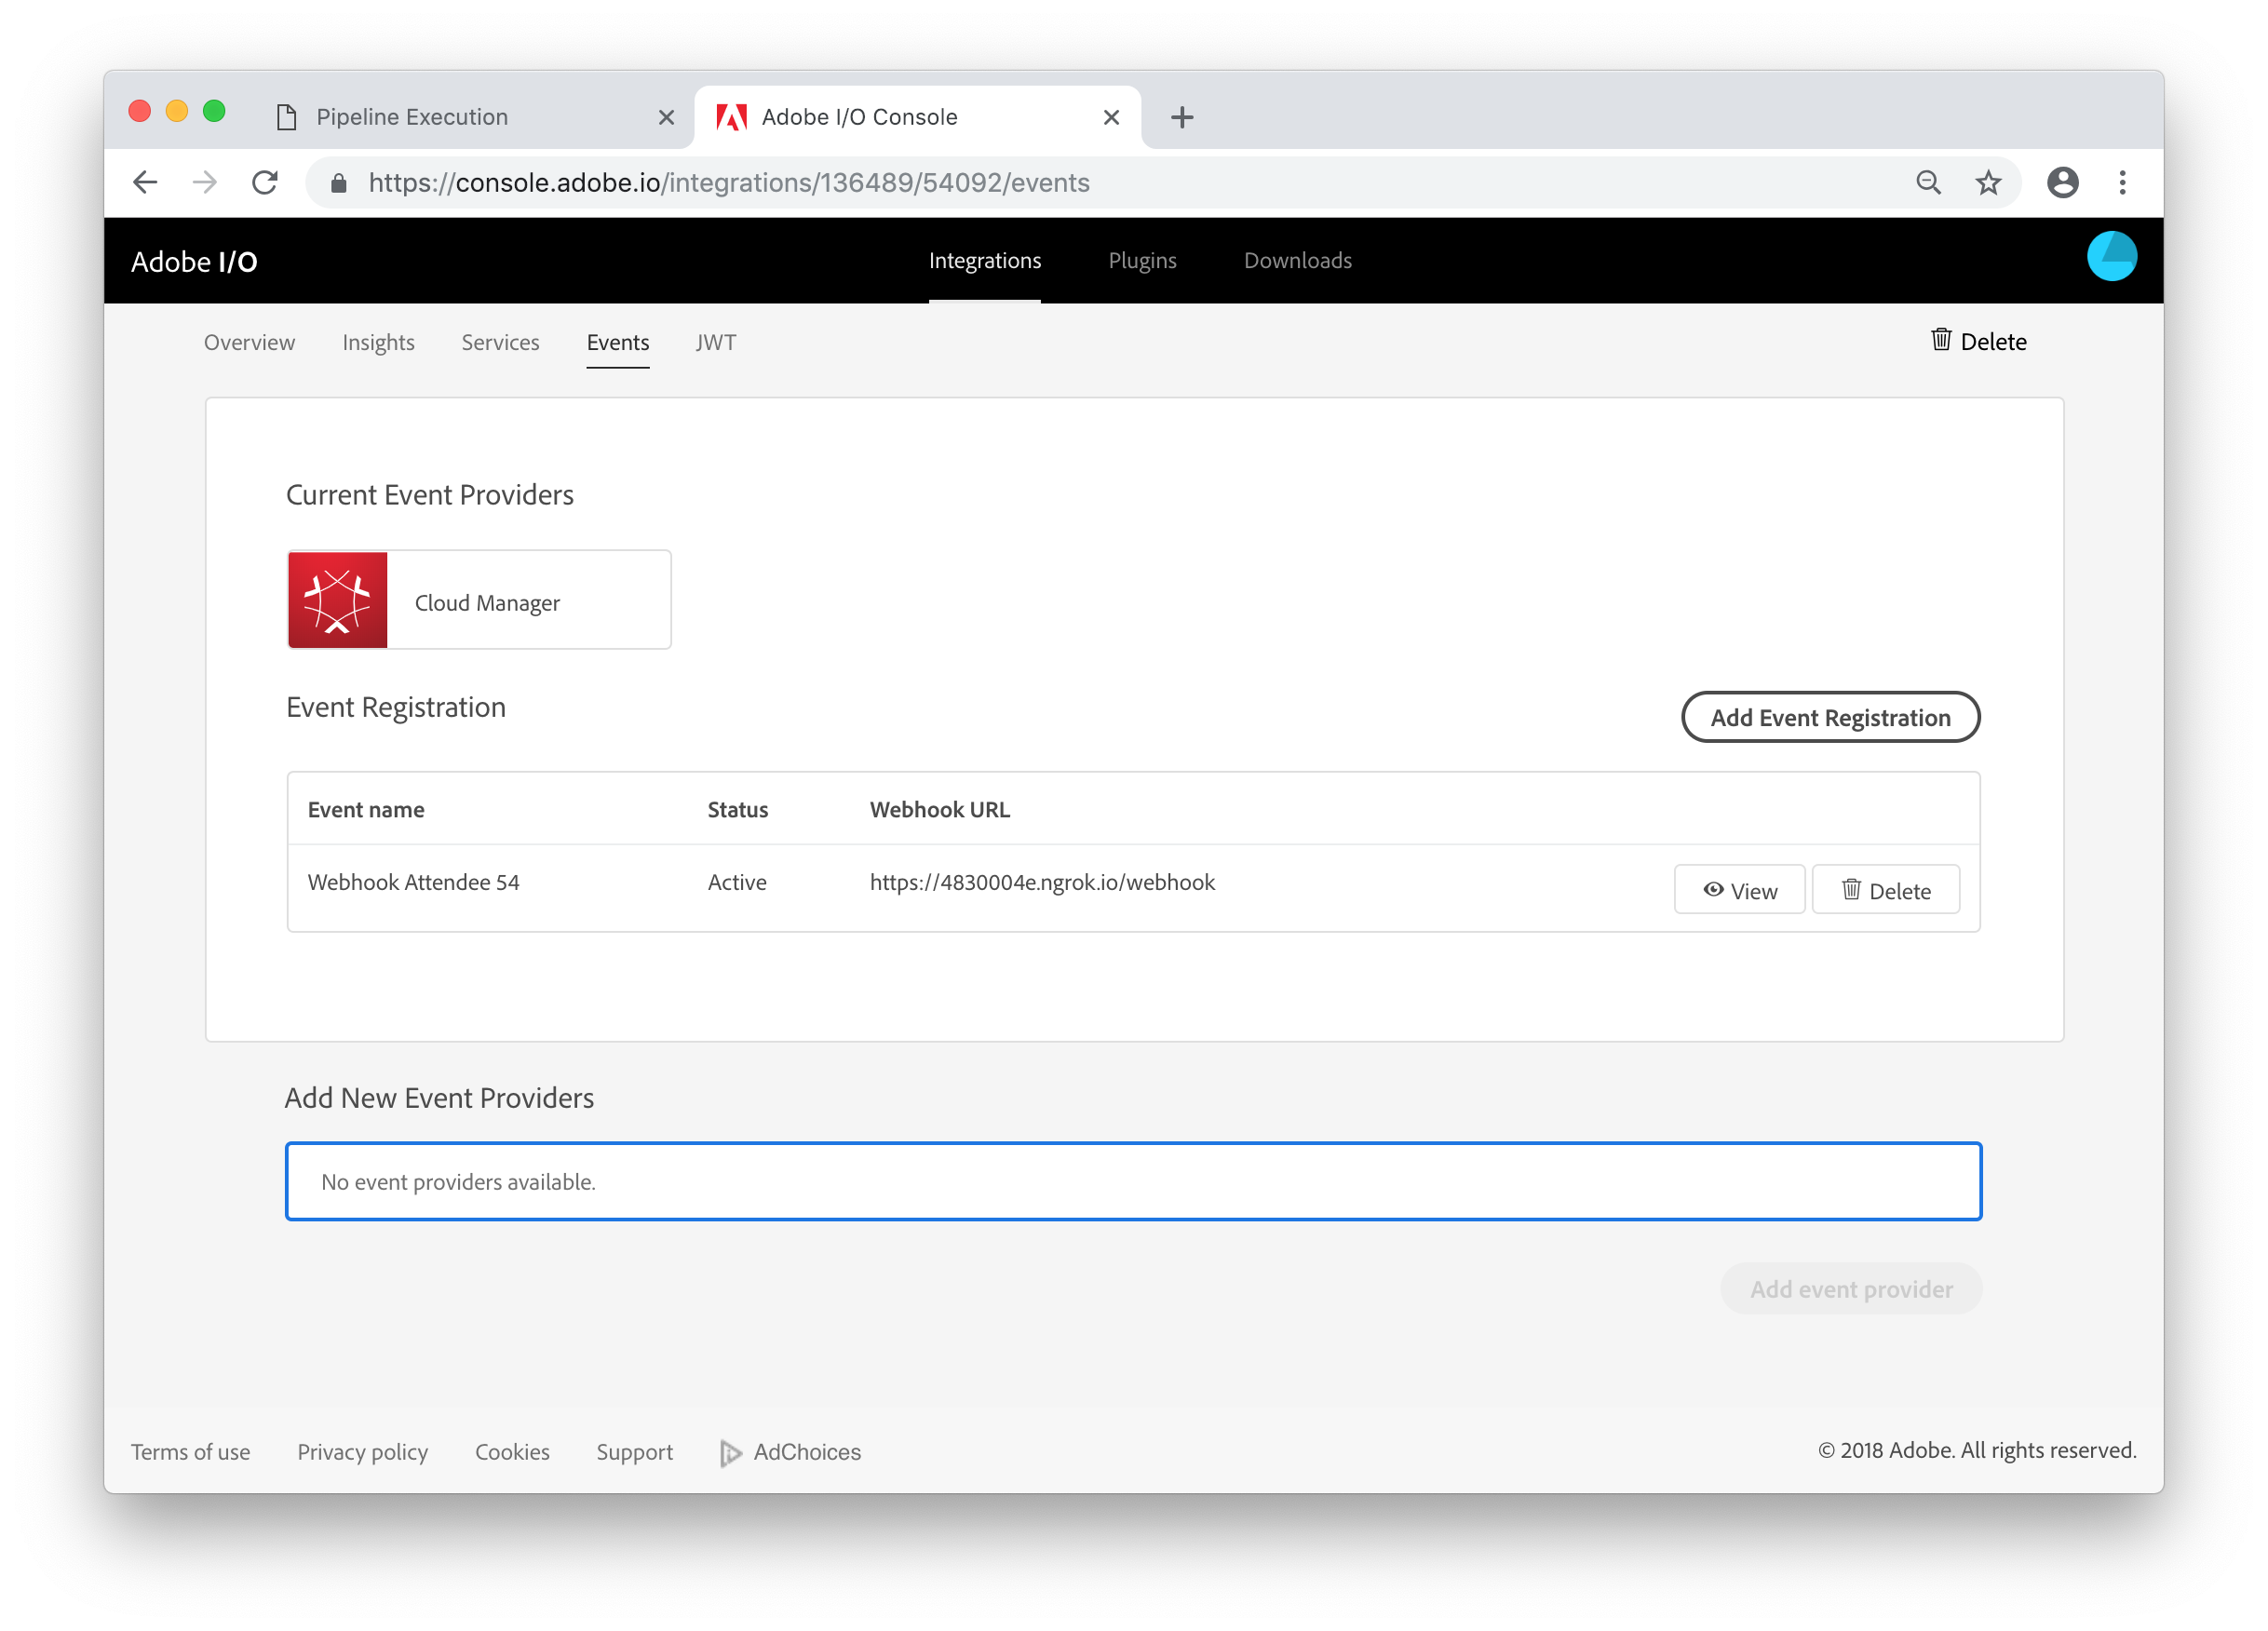
If you've entered the URL correctly, the event registration is now Active.
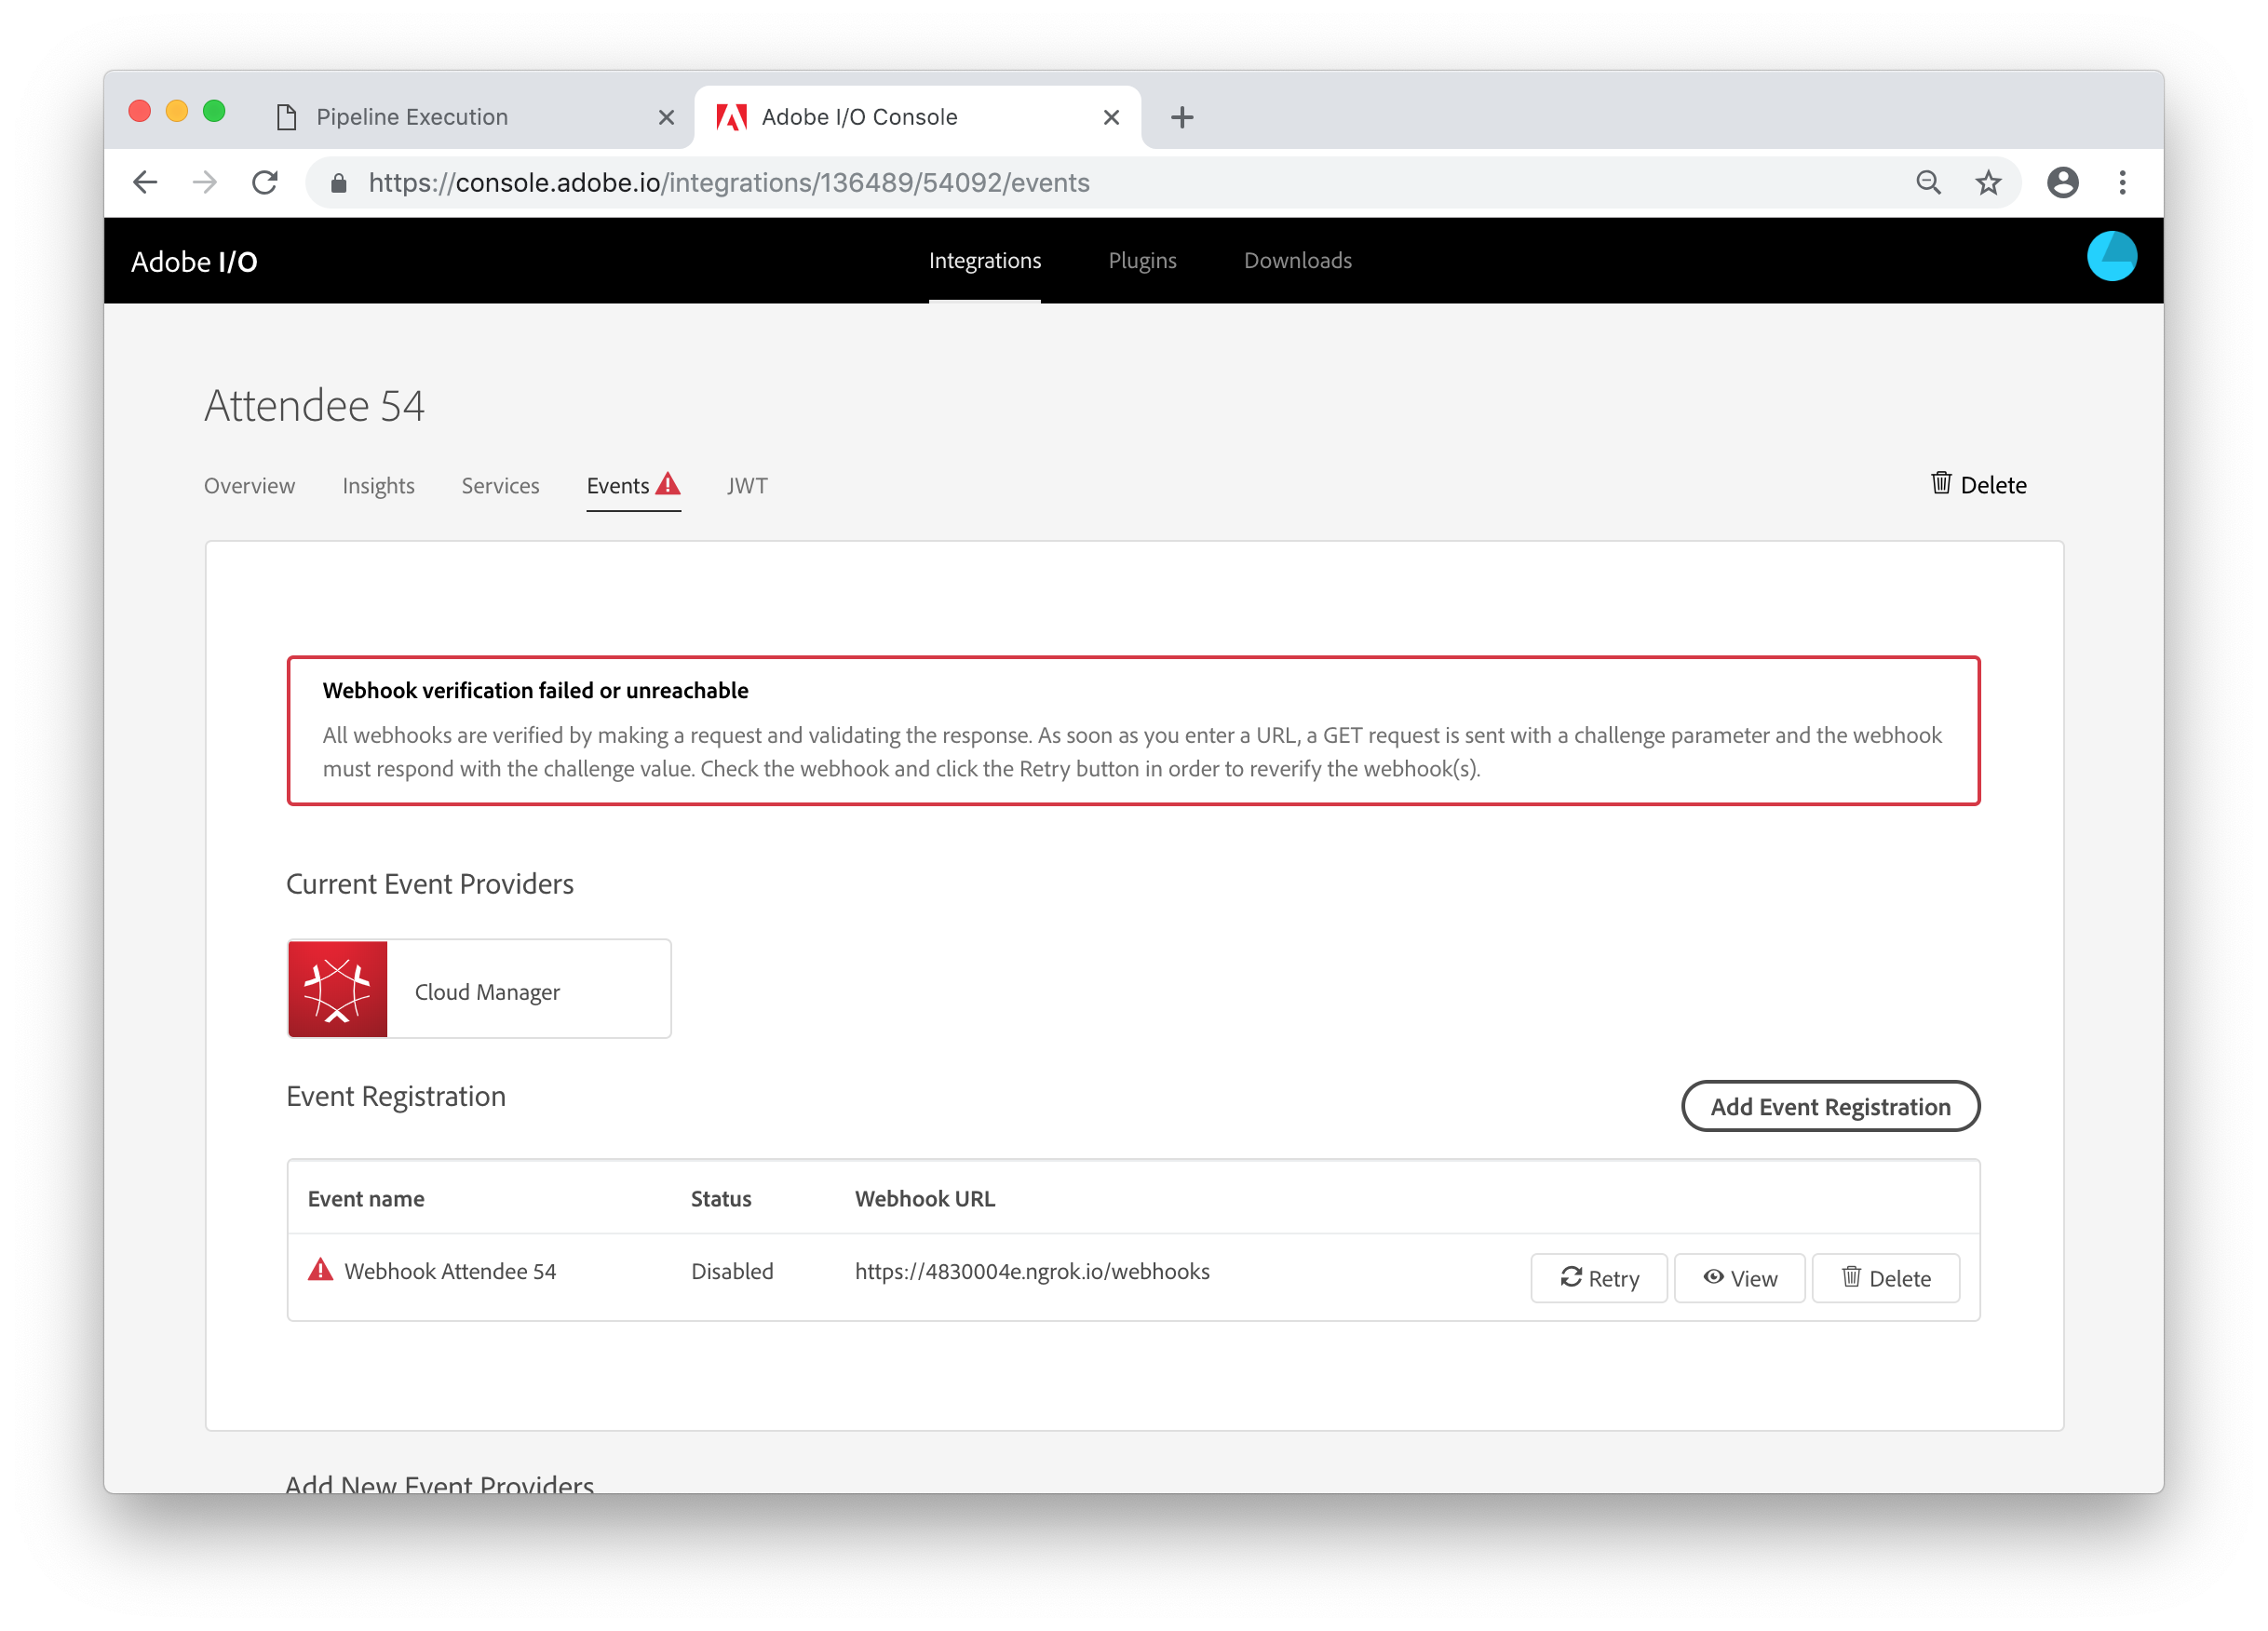
However, if you have entered the wrong URL, you will see a message that the verification has failed. If you see this, click the View button and double check the URL.
In this last lesson, you will test the process end to end by starting the pipeline in Cloud Manager and, if everything is working correctly, observe the resulting notification in Microsoft Teams.
At this point, your webhook and ngrok should be running and registered with Adobe I/O. So now it is time to run the pipeline again. Go back to the Overview page in Cloud Manager, find your pipeline and start it.
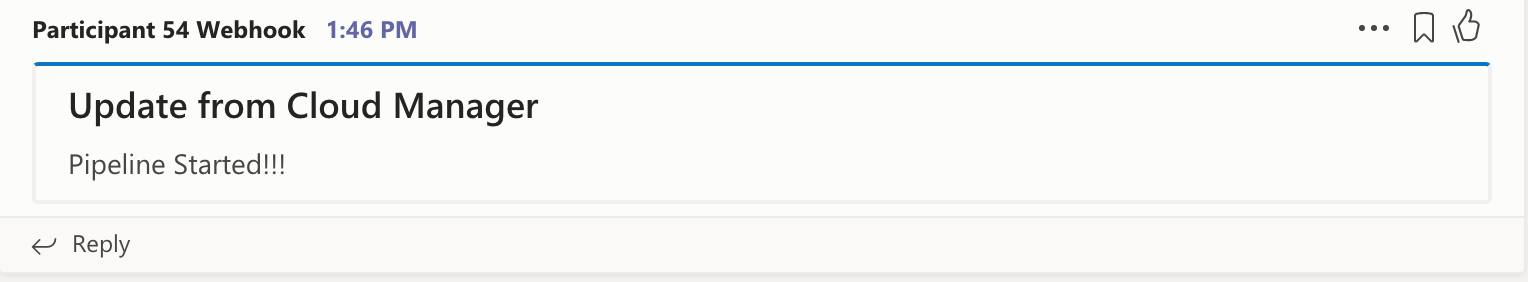
Depending on how quickly everyone in the lab has reached this step, our Microsoft Teams channel is about to get very noisy. Each pipeline start should result in this kind of notification in the channel:
If you see this notification for your pipeline, feel free to experiment with the webhook (see the Next Steps section for some ideas).
If not, you should go back to Lesson 5 and make sure the .env file is set up correctly. If you need to change anything in this file, you need to stop the webhook process (using Ctrl-C) and restart it.
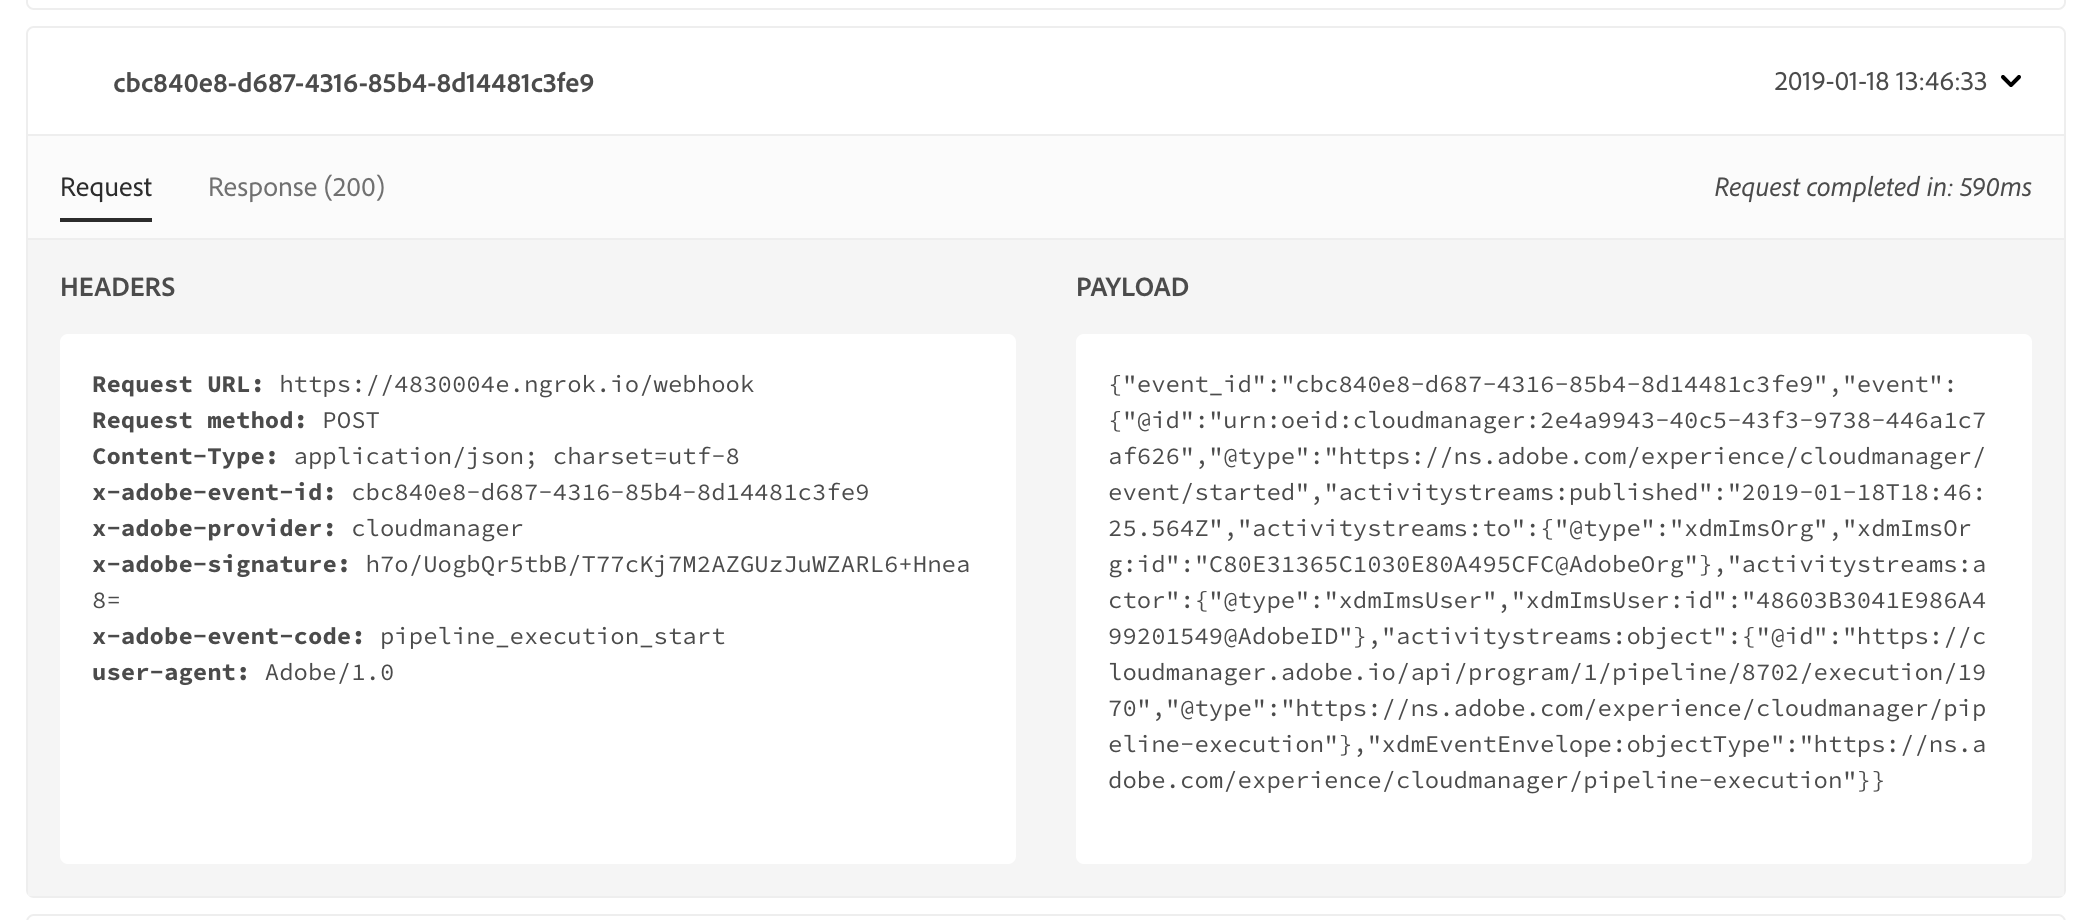
Another thing to look at is the Debug Tracing tab in the Adobe I/O console. This will list the requests sent to your webook. To see this information, click the View button for your Event Registration in the console and select the Debug Tracing tab. This will show you the requests made to your webhook by Adobe I/O.
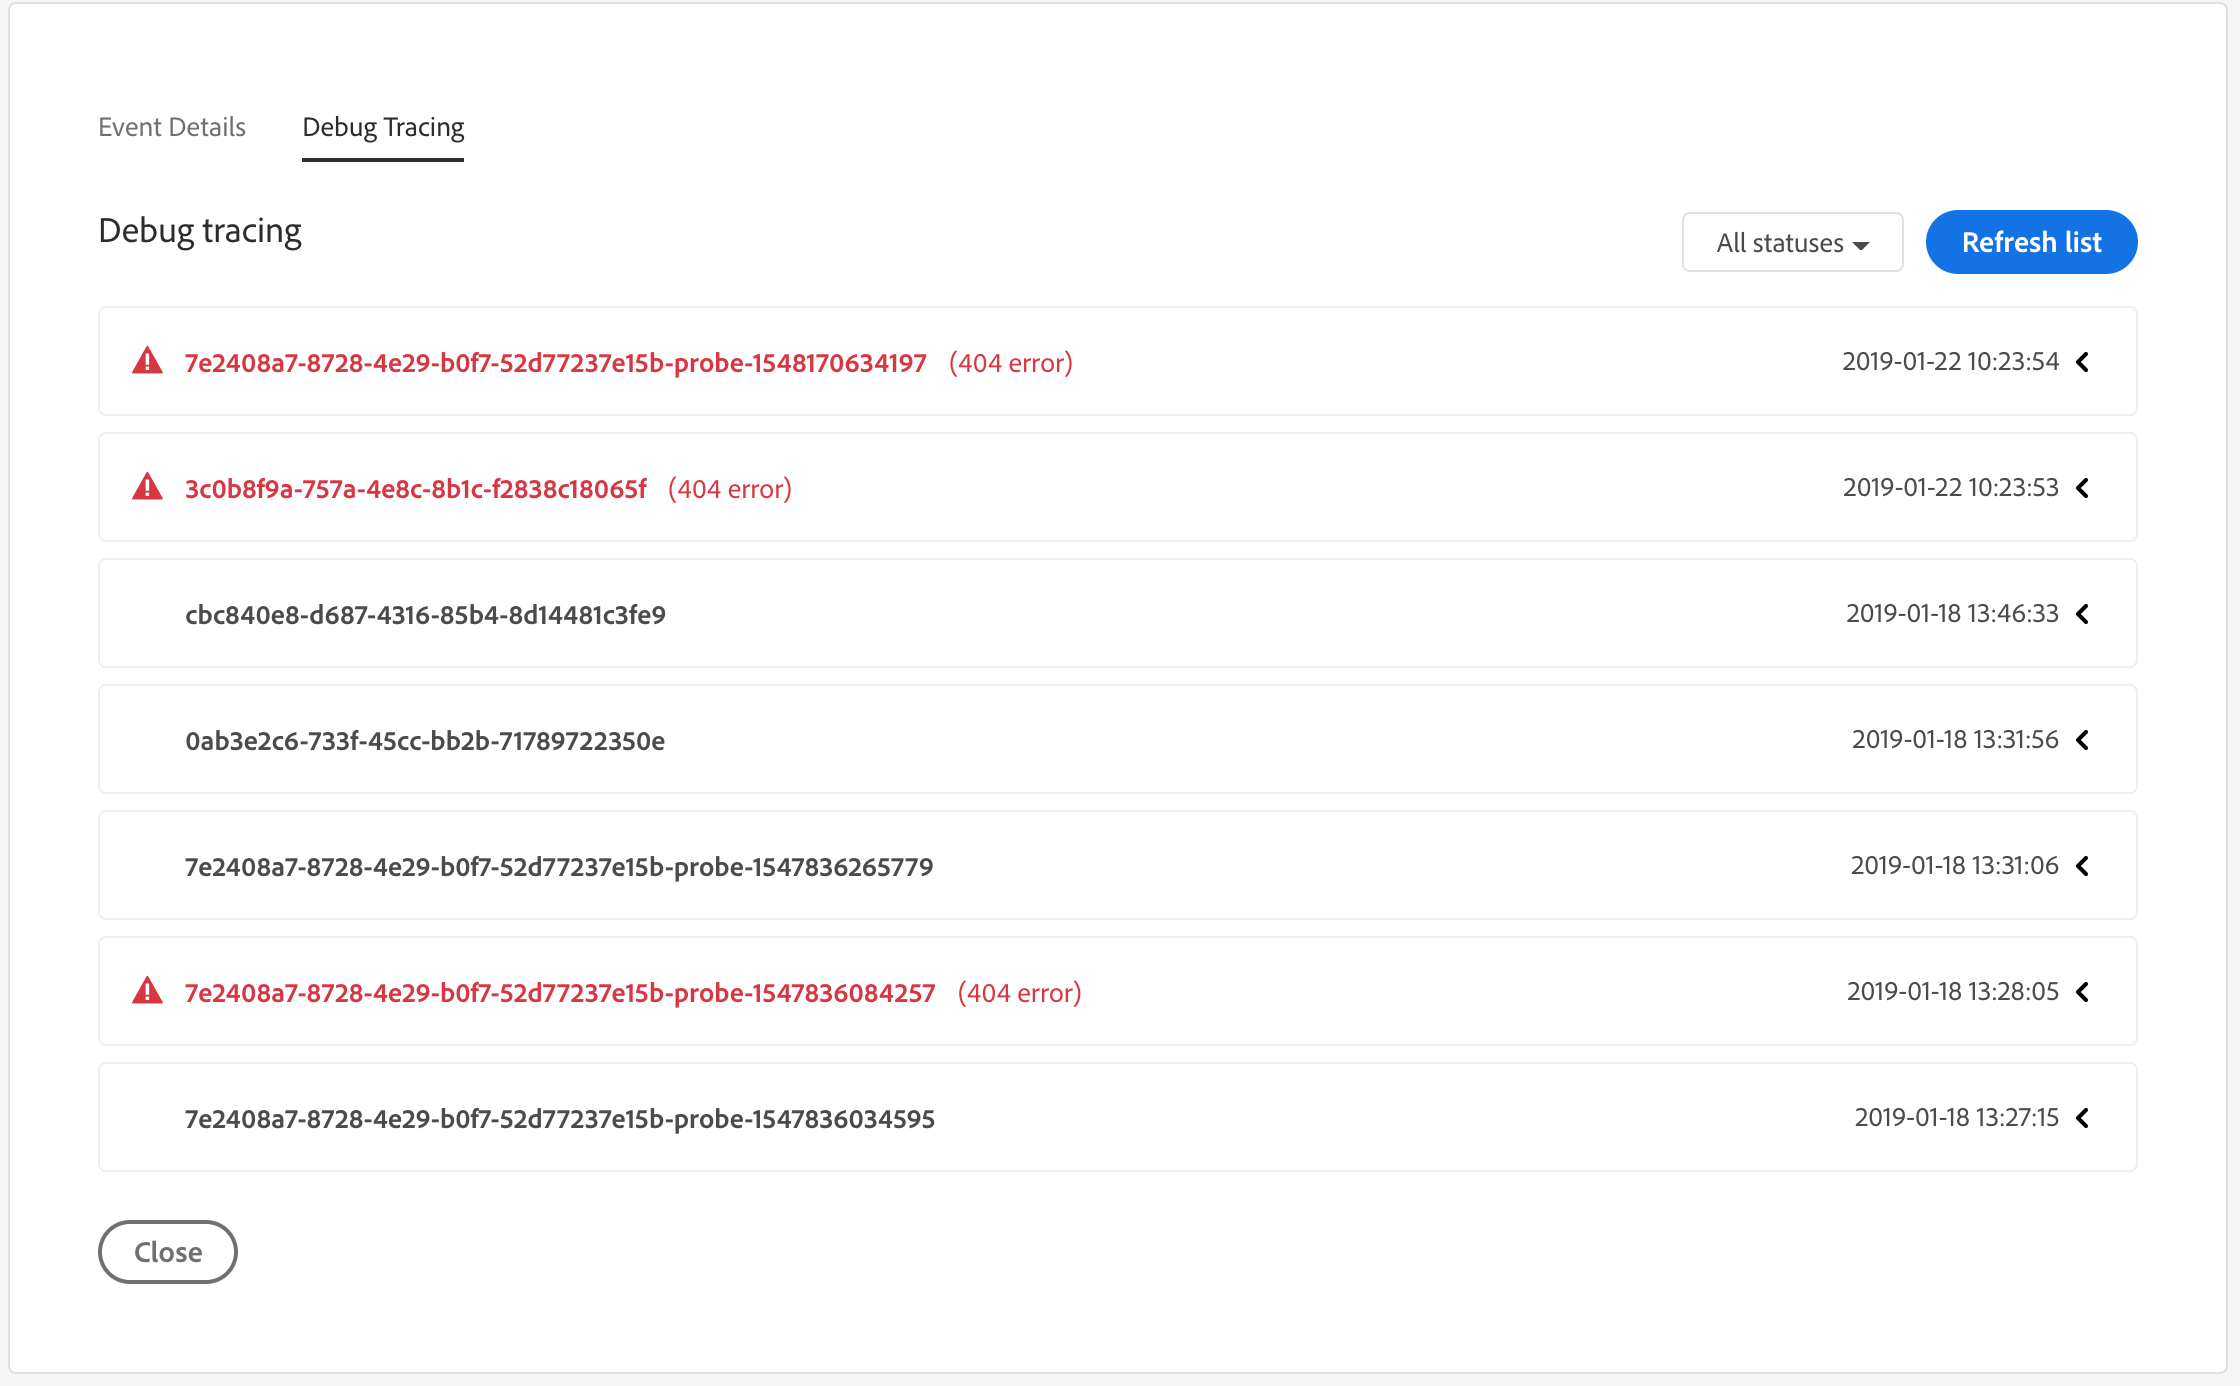
Clicking on one of these entries will show you the headers and body for both the request and response.
If you're still stuck, check with a Lab TA.
In this lab, we have really just scratched the surface of what can be done with the Cloud Manager API and webhooks. If you've gotten this far and want to experiment some more, here are some ideas of things to try:
Remember that anytime you change the webhook code or the
.envfile, you need to stop and restart the webhook process, but you shouldn't restart ngrok.
webhook.js and find where this message is defined.@type property indicates the event type. The list of event types can be found in the API Reference.0072C6; look for this in webhook.js.MANUAL or ON_COMMIT.MessageCard data used for Microsoft Teams notifications, visit https://docs.microsoft.com/en-us/outlook/actionable-messages/message-card-reference.