
Understand the ins and outs of the Adobe Audience Manager Data Explorer. Use trending signals, top unused signals, and saved searches to maximize your time and efficiently optimize your taxonomy. Minimize trait creation "just because," and understand how to backfill historical trait realizations for maximizing audience opportunities.
Note: You will be assigned a three-digit number. Use this as a unique identifier when creating things in Adobe Audience Manager. Throughout this manual, we'll refer to your unique identifier as ###; for example, if your assigned number is 025 and an instruction says to type "Trait ###", you should type "Trait 025".
As a marketer at global toy giant "We R Toys", you're tasked with monitoring the pulse of your audience's activity and creating promotional campaigns from your learnings. You will use Data Explorer to explore some recent anomalous site behavior related to a current event.
Login to https://bank-demo.demdex.com with the following credentials:
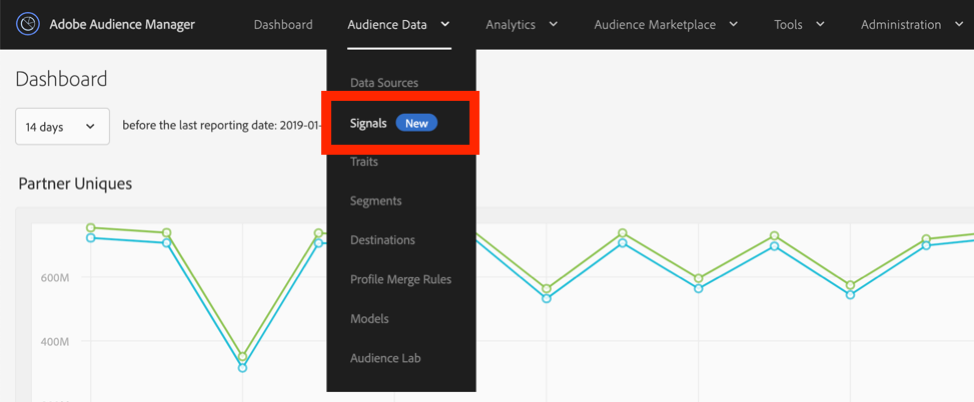
Navigate to the Signals application by selecting Audience Data > Signals from the top navigation
Figure 1: Signals in the top navigation
You are now on the Signals Dashboard page
Figure 2: Signals Dashboard page

Get familiar with the Top Unused Signals and New Unused Signals dashboards. What criteria (counts/date ranges) are driving the queries that power these dashboards?
Figure 3: Top Unused Signals
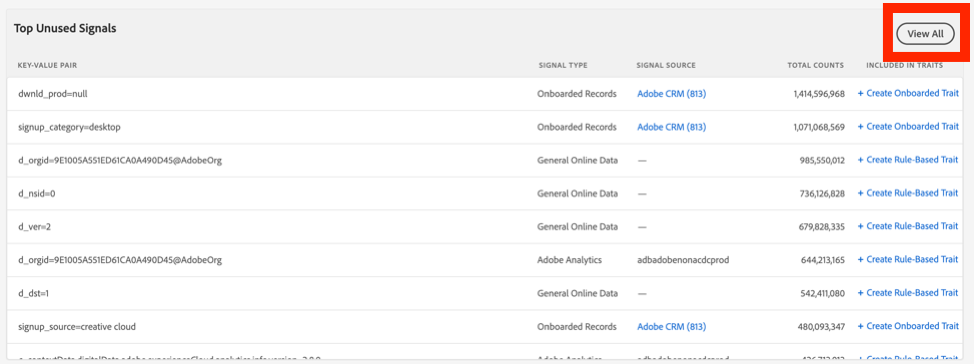
Solution: Click "View All" on the top right corner of each dashboard, then click the "Dashboard" tab to return to the Dashbaord
Browse the Top Unused Signals table in the dashboard to discover signals with the highest week-over-week activity that you aren’t acting on. One of these signals indicates that visitors have been having trouble finding what they’re searching for on your site. While this isn’t a new signal, it should be on your radar as one of your unused signals with the largest increase in activity this week.
Can you identify this signal?
Figure 4: Top Unused Signals
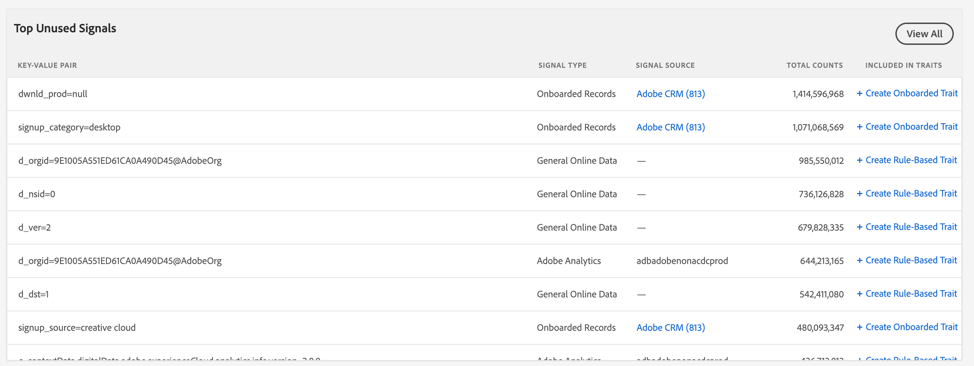
Solution: page=NoResults.html
To act on this signal—for example, by sending these visitors a follow up "Didn’t find what you’re looking for?" email—you would then click "Create Rule-Based Trait" or "Create Onboarded Trait" to enter the trait creation workflow and start capturing the audience who reached the "No Results" page of "We R Toys". We will explore trait creation in-depth later in Exercise 3.
You follow this lead over to the New Unused Signals table, where you can discover your most active unused signals that have fired for the first time during the last week. One of these signals indicates that searches for a certain toy have gone through the roof.
Can you identify this signal?
Figure 5: New Unused Signals
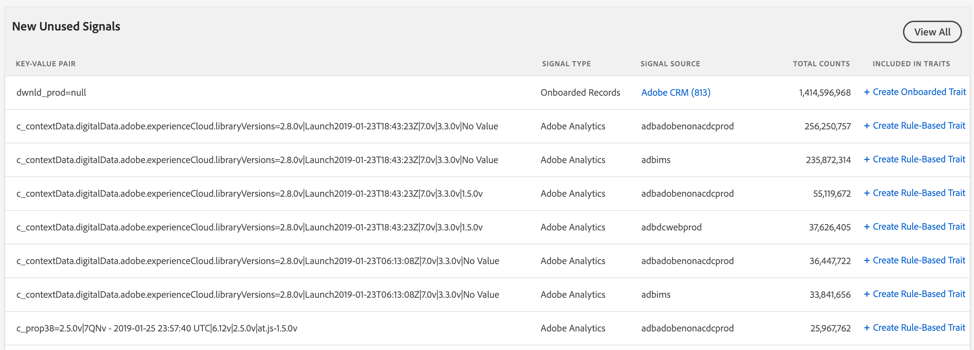
Solution: search=BopIt
Using these two insights, you understand that there’s a recent demand for the BopIt. After some Googling, you discover that on March 22, 2019, YouTube and Instagram star Rickey Thompson made a viral video with an old BopIt, popularizing it and driving your customers to search your catalog for it. But you check the "We R Toys" website to find that it’s out of stock.
This surge in activity explains why the signal page="NoResults.html" appeared in Top Unused Signals and why the signal search="BopIt" appeared in New Unused Signals—your visitors are searching for BopIts, but you aren’t carrying them.
As a marketer, you’ve used Data Explorer to find insights about your audience activity, and now you can react to it by restocking the BopIt and meeting your customers’ demand.
As an analyst at "We R Toys", you’re tasked with dissecting a high volume of visitor traffic for meaningful insights about your customers. Thanks to what appears to be a recent surge in millennial nostalgia for classic games, "We R Toys" is also seeing a spike in search activity for the 1st generation Pokemon Gameboy games, Pokemon Red, and Pokemon Blue. These games are showcased on the site’s Pokemon Gameboy page, which is tagged with the signal page=PokemonGameboy.html.
You want to quantify the level of interest for Pokemon Blue. To do this, search for the event counts of the signal gameboy=PokemonBlue in the last 7 days.
Navigate to the Signals Search page
Figure 6: Signals Search page

Search for the event counts of the signal gameboy=PokemonBlue over the last 7 days
Figure 7: Search inputs filled in
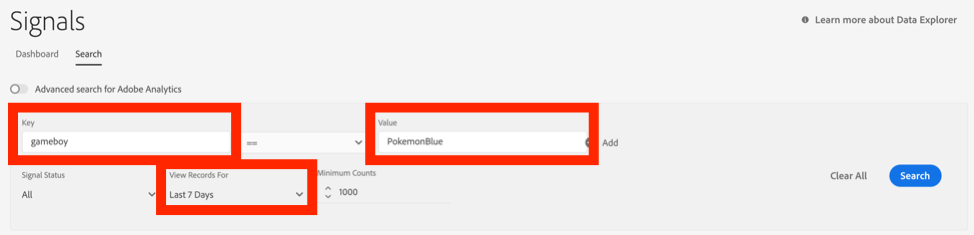
Solution:
You are only interested in the counts for general online activity for Pokemon Blue; filter the search results for this criterion
Figure 8: Filter for general online activity selected
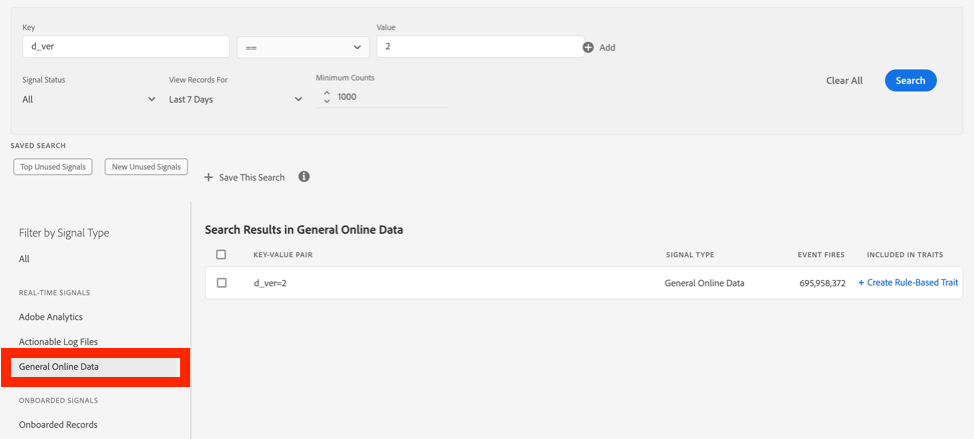
Solution: Click on "General Online Data" under Filter by Signal Type, to the left of the search results
Note: Entering a value for the "Key" input and then leaving the "Value" input blank allows you to search across all signals with that key, with a wildcard for the value. Additionally, key and value inputs are case-insensitive.
As an analyst for "We R Toys", you now want to quantify the level of interest for all toys in the 1st generation Pokemon Gameboy series in the last 14 days, with a minimum count threshold of 1500. Run a search to determine this.
Figure 9: Search inputs filled in
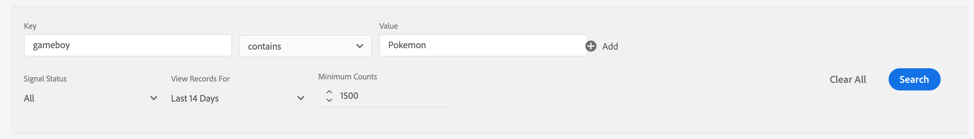
Solution:
You also want to quantify activity for users in the last 30 days who navigated to the Pokemon Gameboy page and clicked on Pokemon Red, using the default counts threshold. Run a search to determine this.
Figure 10: Search inputs filled in
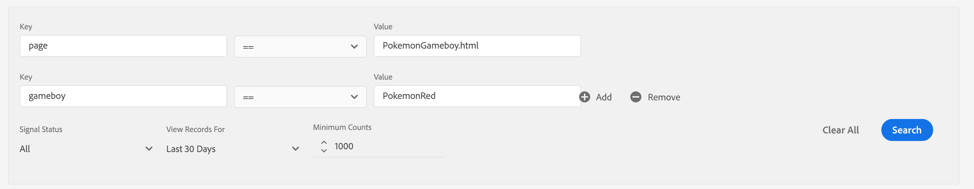
Solution:
Note: When searching for multiple key-value pairs, they are joined with the logical "AND" operator.
You would like to view the results of the search in exercise 2.3 on the dashboard, instead of having to navigate to the search page. Create a saved search that can be easily accessed and viewed on the dashboard.
Figure 11: Save This Search button
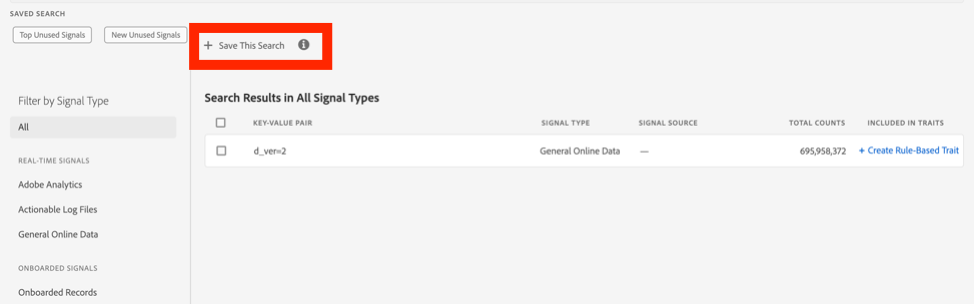
Figure 12: Save This Search dialog
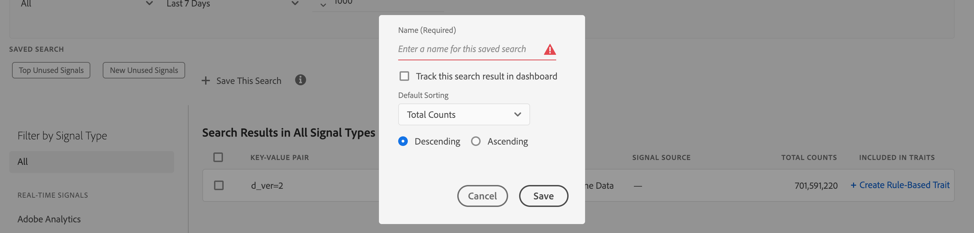
Solution:
Pro Tip: Optimize signal search efforts by saving up to 10 sets of search criteria to use whenever you need them and track them on the Dashboard. Audience Manager reloads the saved searches every time you load the Dashboard.
"We R Toys" is also an Adobe Analytics customer. You want to search for Pokemon Gameboy page visits in the last 10 days (excluding today), linked to the Report Suite "we-r-toys-aa-reportsuite".
Figure 13: Advanced Search for Adobe Analytics with search inputs filled in
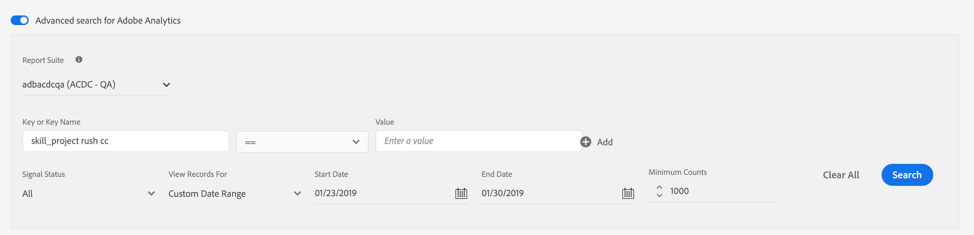
Solution:
As a marketer at "We R Toys" and colleague of the analyst from the previous exercise, you want to target customers interested in the 1st generation Pokemon Gameboy series. Last month, you led a media promotion for Pokemon Red and and Pokemon Blue, but you accidentally forgot to create a trait to gather conversion data for it.
Luckily, "We R Toys" is on the Data Explorer Premium offering, which provides the ability to create backfilled traits that capture historical realizations—as if the trait had been created in the past. You will create a conversion trait based off a high performing signal from your promotion, then use this backfill feature to maximize the trait population.
You want to target users who actively navigated to the Pokemon Gameboy page (page=PokemonGameboy.html) and searched for Pokemon Red (gameboy=PokemonRed). Search for this activity in the last 30 days and navigate to the trait creation workflow from the search result.
Figure 14: After signals are searched, trait creation is available
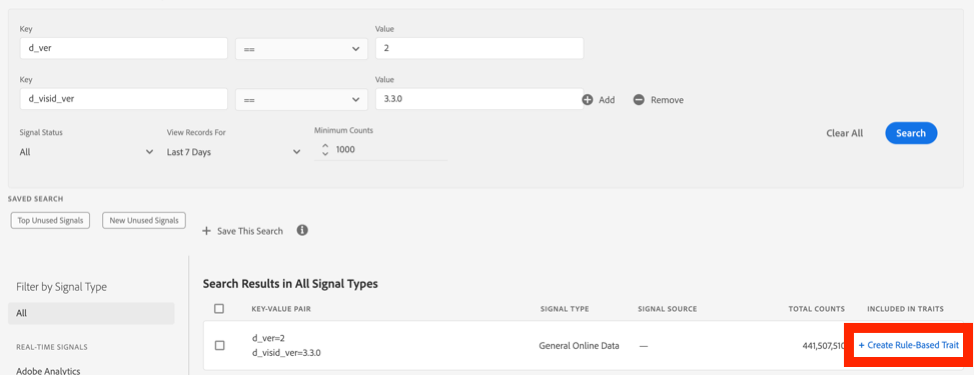
Solution:
Fill in the following basic information about your trait:
Don’t click "Save" yet! Proceed to Exercise 3.2.
On the trait builder screen, the analyst rethinks the trait definition, and wants to now expand the definition of the audience to include users who navigated to the Gameboy showcase page OR users who searched for Pokemon Red.
Figure 15: Trait Expression Builder
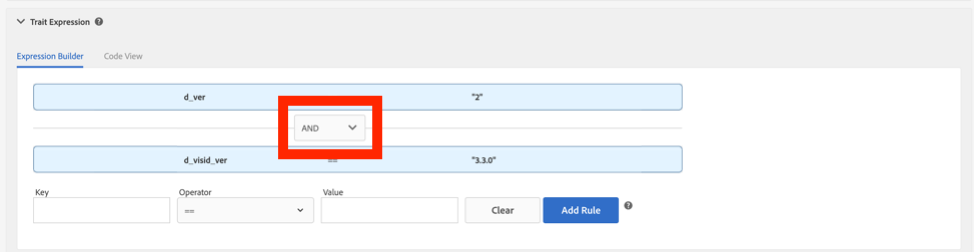
Solution: Under the "Trait Expression" section, in the "Expression Builder" view, change the operator value in the dropdown from AND to OR
Don’t click "Save" yet! Proceed to Exercise 3.3.
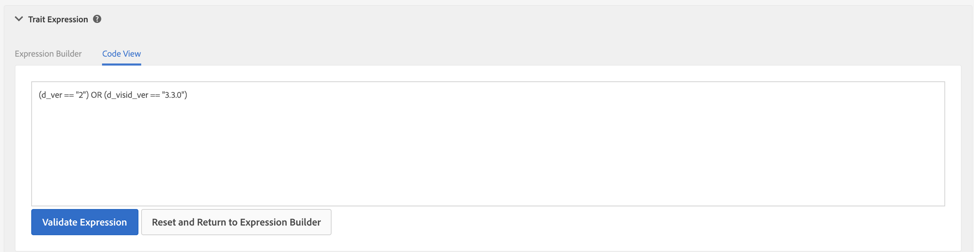
Pro tip: The change in operator value can also be done in the "Code View":
Figure 16: Code View
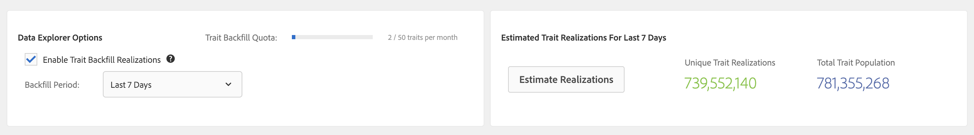
You want to capture backfill realizations for this trait. Since you entered the trait creation flow from the Signals page—and since "We R Toys" has Data Explorer Premium—Adobe Audience Manager will enable backfill for this trait by default.
You now want to see the estimated trait realizations for the last 7 days for this modified trait rule, and then finally create the trait with backfill for 30 days.
Figure 17: Data Explorer options: backfill and estimated trait realizations
Solution:
Note: Data Explorer allows you to backfill up to 50 traits per month, with the backfill counter being reset on the 1st day of each month. For the purposes of this demo, the limit is 500 traits.
Because there is a latency period between creating a backfilled trait and Adobe Audience Manager populating that trait’s metrics with backfilled realizations, we have prepared a demo backfilled trait for you ahead of time. Navigate to that trait’s summary page.
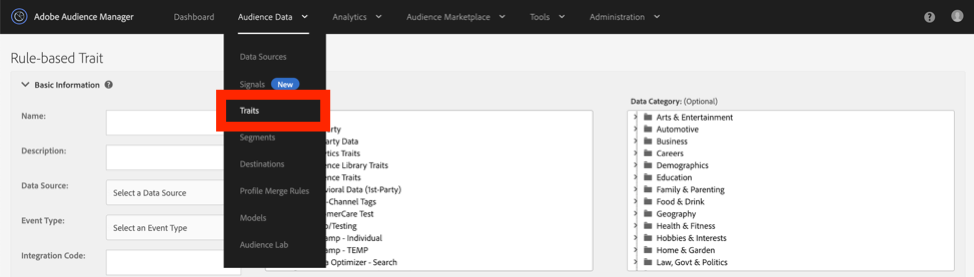
Navigate to the trait list page by selecting Audience Data > Traits from the top navigation
Figure 18: Traits in the top navigation
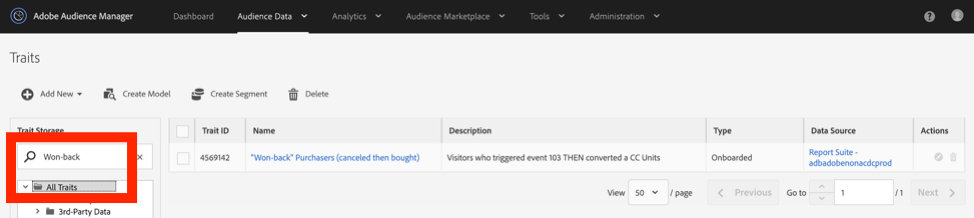
Search for "demo", then type "Enter"
Click "Pokemon Games – 1st Generation (demo)"
Figure 19: Searching for the trait "Pokemon Games – 1st Generation (demo)"
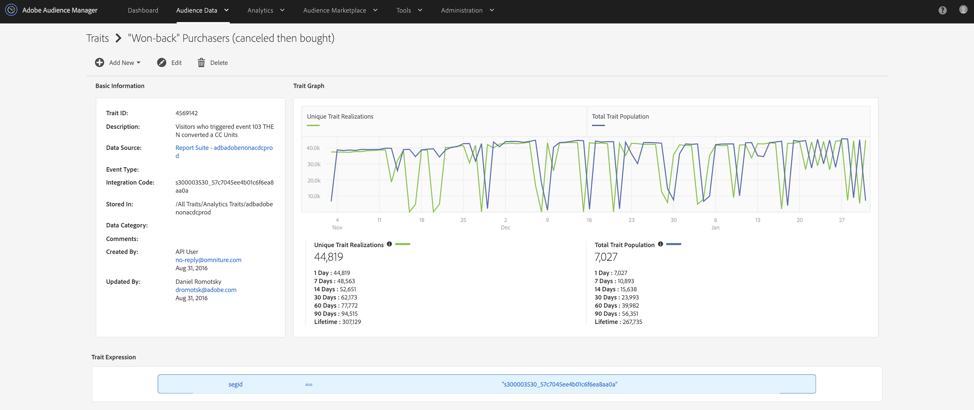
The graph and data for this backfilled trait include retroactively populated metrics for Unique Trait Realizations and Total Trait Population, based on activity that would have triggered a trait realization within the previous 30 days, as if the trait had been created 30 days before it actually was.
Figure 20: Trait graph and data
Now that you have had hands-on experience with Data Explorer in a lab setting, it’s time for you to get familiar with real-world data—your data!
Data Explorer product documentation: https://marketing.adobe.com/resources/help/en_US/aam/data-explorer.html
Trait Qualification Reference: https://marketing.adobe.com/resources/help/en_US/aam/trait-qualification-reference.html
Audience Manager Product Documentation: https://marketing.adobe.com/resources/help/en_US/aam/