
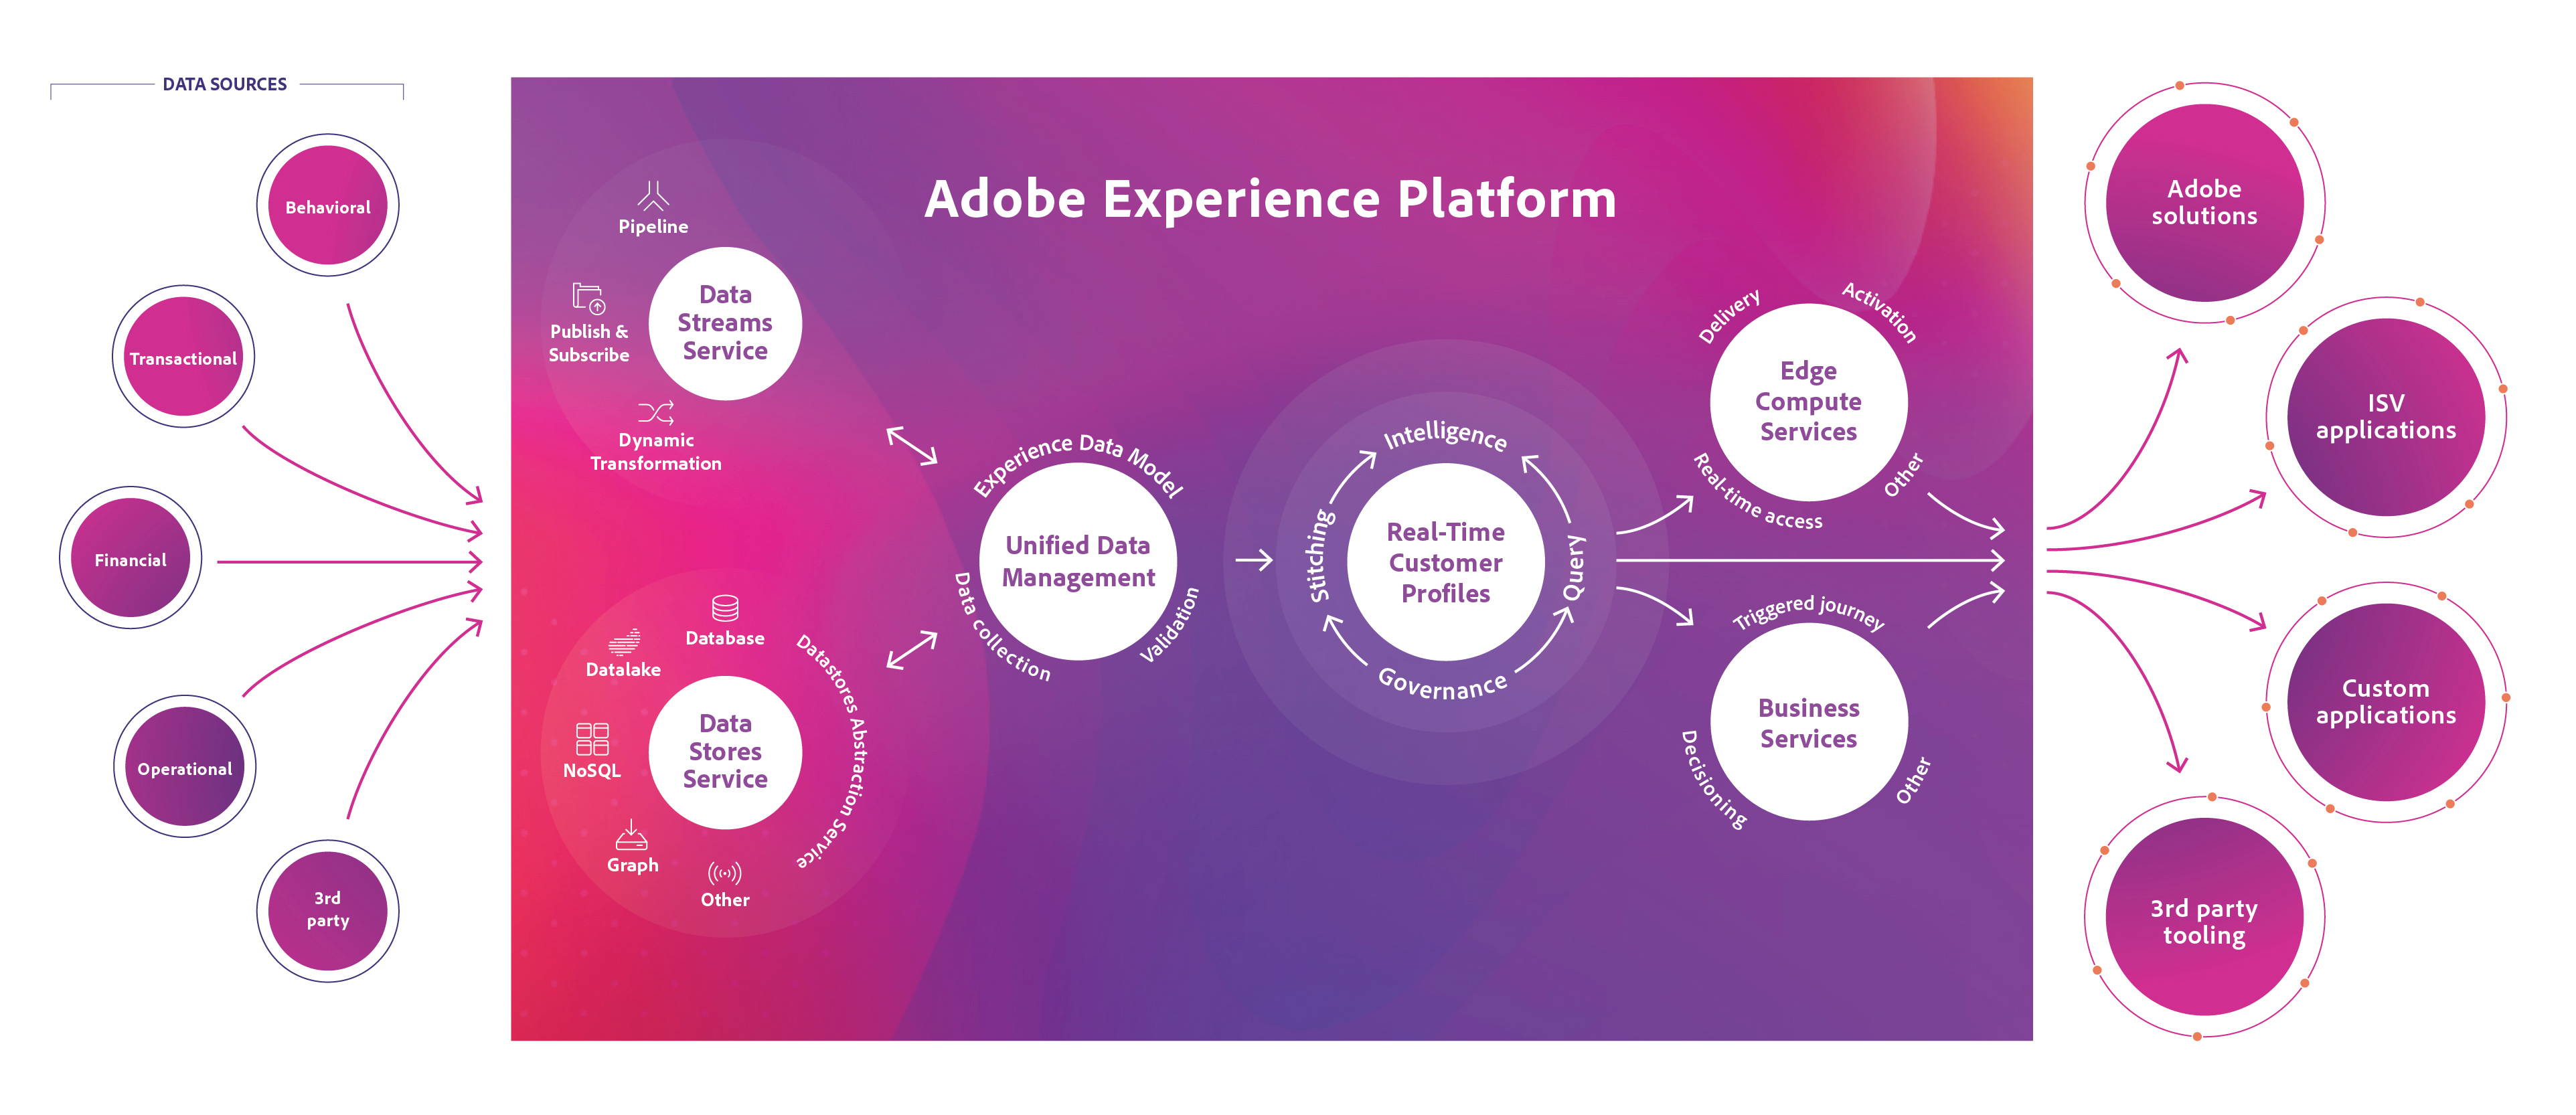
Experience Platform is a purpose-built cloud offering that centralizes and standardizes customer data across the enterprise powering a unified customer profile, enabling analysis/data science and data governance to drive real-time personalized experiences. Experience Platform weaves all your critical customer data together in real time. This include behavioral, transactional, financial, operational, and third-party data and not just CRM or other first-party data.
Bring in your data, standardize it, make it smarter. See what your customer wants right now and build experiences to match.
In this hands-on lab session, you will learn to:
After completing the lab, you will be able to do the following:
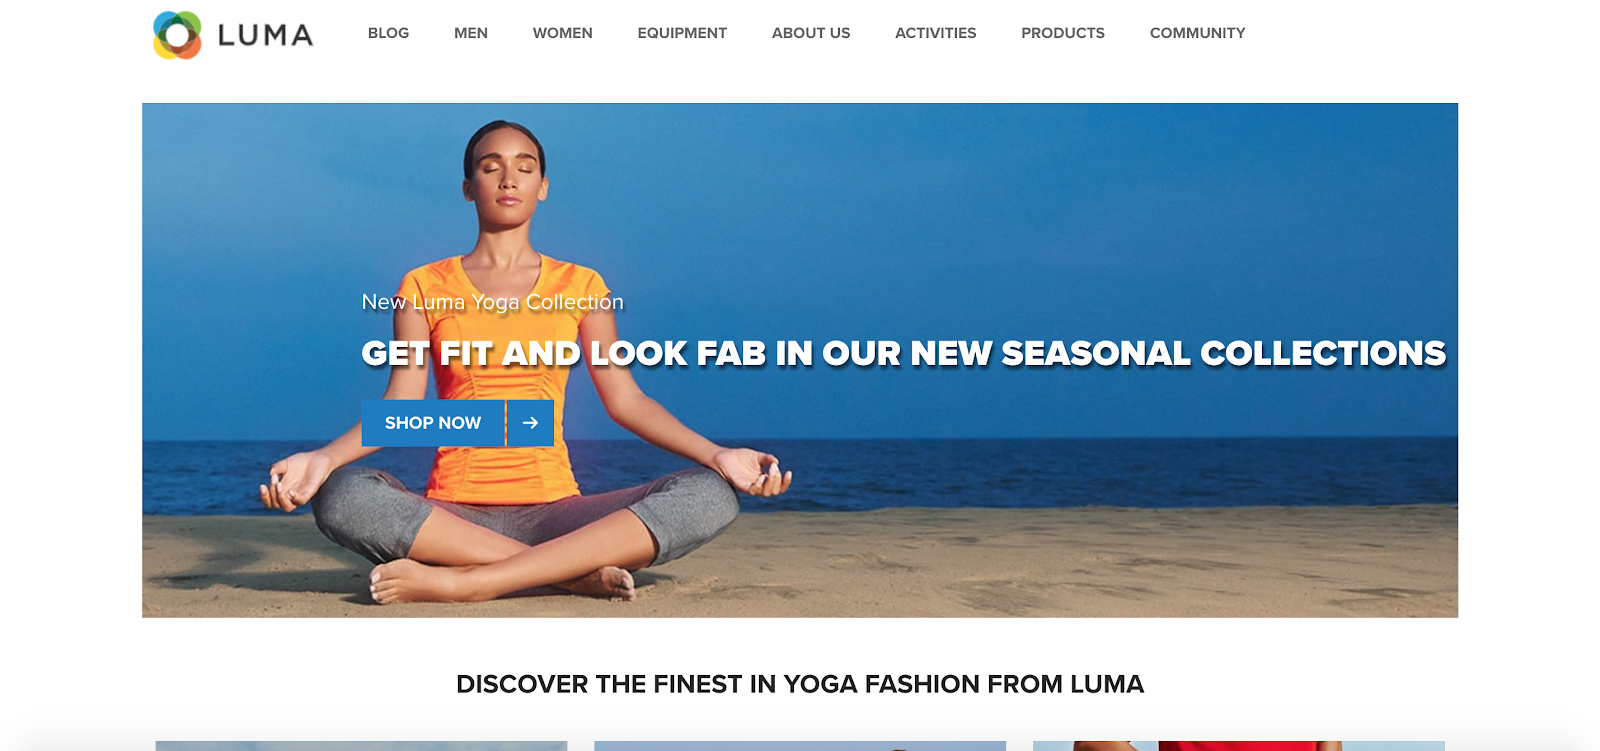
Luma (a fictitious company) is a recognized activewear manufacturer and retailer with more than 230 stores spanning 43 states and growing: https://publish1034.adobedemo.com/content/luma/us/en/about-us.html
Luma seeks to boost quarterly sales through effective personalization and targeted promotions to its customers. But not all customers are alike. How to arrive at a centralized view of customers’ preferences and interactions with the brand? Who to target, when, and on what channel? How to personalize products and content for each customer? How to continuously measure and analyze customer behavior?
Create rich and complete real-time customer profiles encompassing demographic information, transaction history, behavioral data, and attributes like status and loyalty to drive personalization, omni-channel analysis, and ML/AI driven actionable insights.
 Concept - Experience Platform Data Pipeline
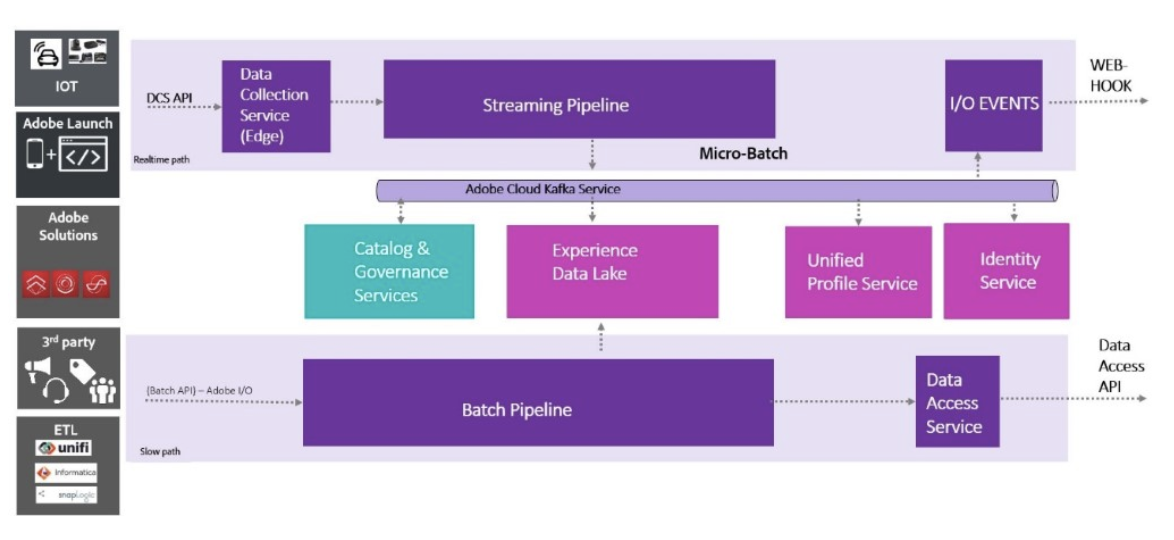
Data is at the core of Experience Platform. The data processing at the at the heard of Experience Platform centralizes customer data across the enterprise and persists it in an optimized, standardized format.
Batch Pipeline is optimized for large volumes of data whether you’re bringing data in or reading it back out. It encompasses Batch Ingestion APIs/SDKs, Connectors for non-Adobe Applications, bi-directional integration with ETL vendors (Unifi, Informatica, SnapLogic) for access to 100s+ applications, and Batch Data Access APIs.
Streaming Pipeline is optimized for real-time data ingestion and real-time activation of customer data & insights. It is powered by a globally deployed Data Collection Service for capturing events at the edge, Streaming Processing APIs to process collected data in-motion, and integrates with Adobe I/O events for publishing events back to Adobe and non-Adobe applications.
Adobe Solution Connectors ingest data (batch & streaming) from Adobe Solutions such as Campaign, Target, Audience Manager, Analytics, and AdCloud into Experience Platform for generating real-time customer profiles.
Adobe Launch is Adobe's next-generation tag management system and client-side platform that makes it easy to capture web & mobile behaviors and publish those events to Experience Platform in real-time.
Adobe Experience Data Model (XDM) provides open, standardized, extensible schemas to represent an organization’s customer data model, thereby enabling immediate semantic understanding and actioning of the data as soon as it lands in Experience Platform. All customer data is transformed into conformant schemas before being written to Experience Platform.
Adobe Experience Data Lake is the optimized persistent storage for customer data for driving analytic workloads.
Unified Profile Service provides a real-time complete view on customer and time-series data which can then be used for creating segments and audiences which can be activated within Adobe and non-Adobe applications.
Identity Service stitches user identities together, across devices and systems, for a complete view within Unified Profile.
Catalog & Governance Service provides metadata management, data classifications, and data usage policy management for all data in Adobe Experience Platform.
To learn more click here: https://www.adobe.io/apis/experienceplatform/home.html
In this part, we will learn how Experience Platform impacts a typical customer journey at Luma, an outdoor retail company with both online and offline touchpoints. Luma is using Experience Platform and the Unified Profile Service to create segments that can be used across the Adobe Experience Cloud solutions.
Let's start with logging into Experience Platform UI.
Navigate to Experience Platform Login Page: https://platform.adobe.com
Use the supplied credentials and click “Sign in”
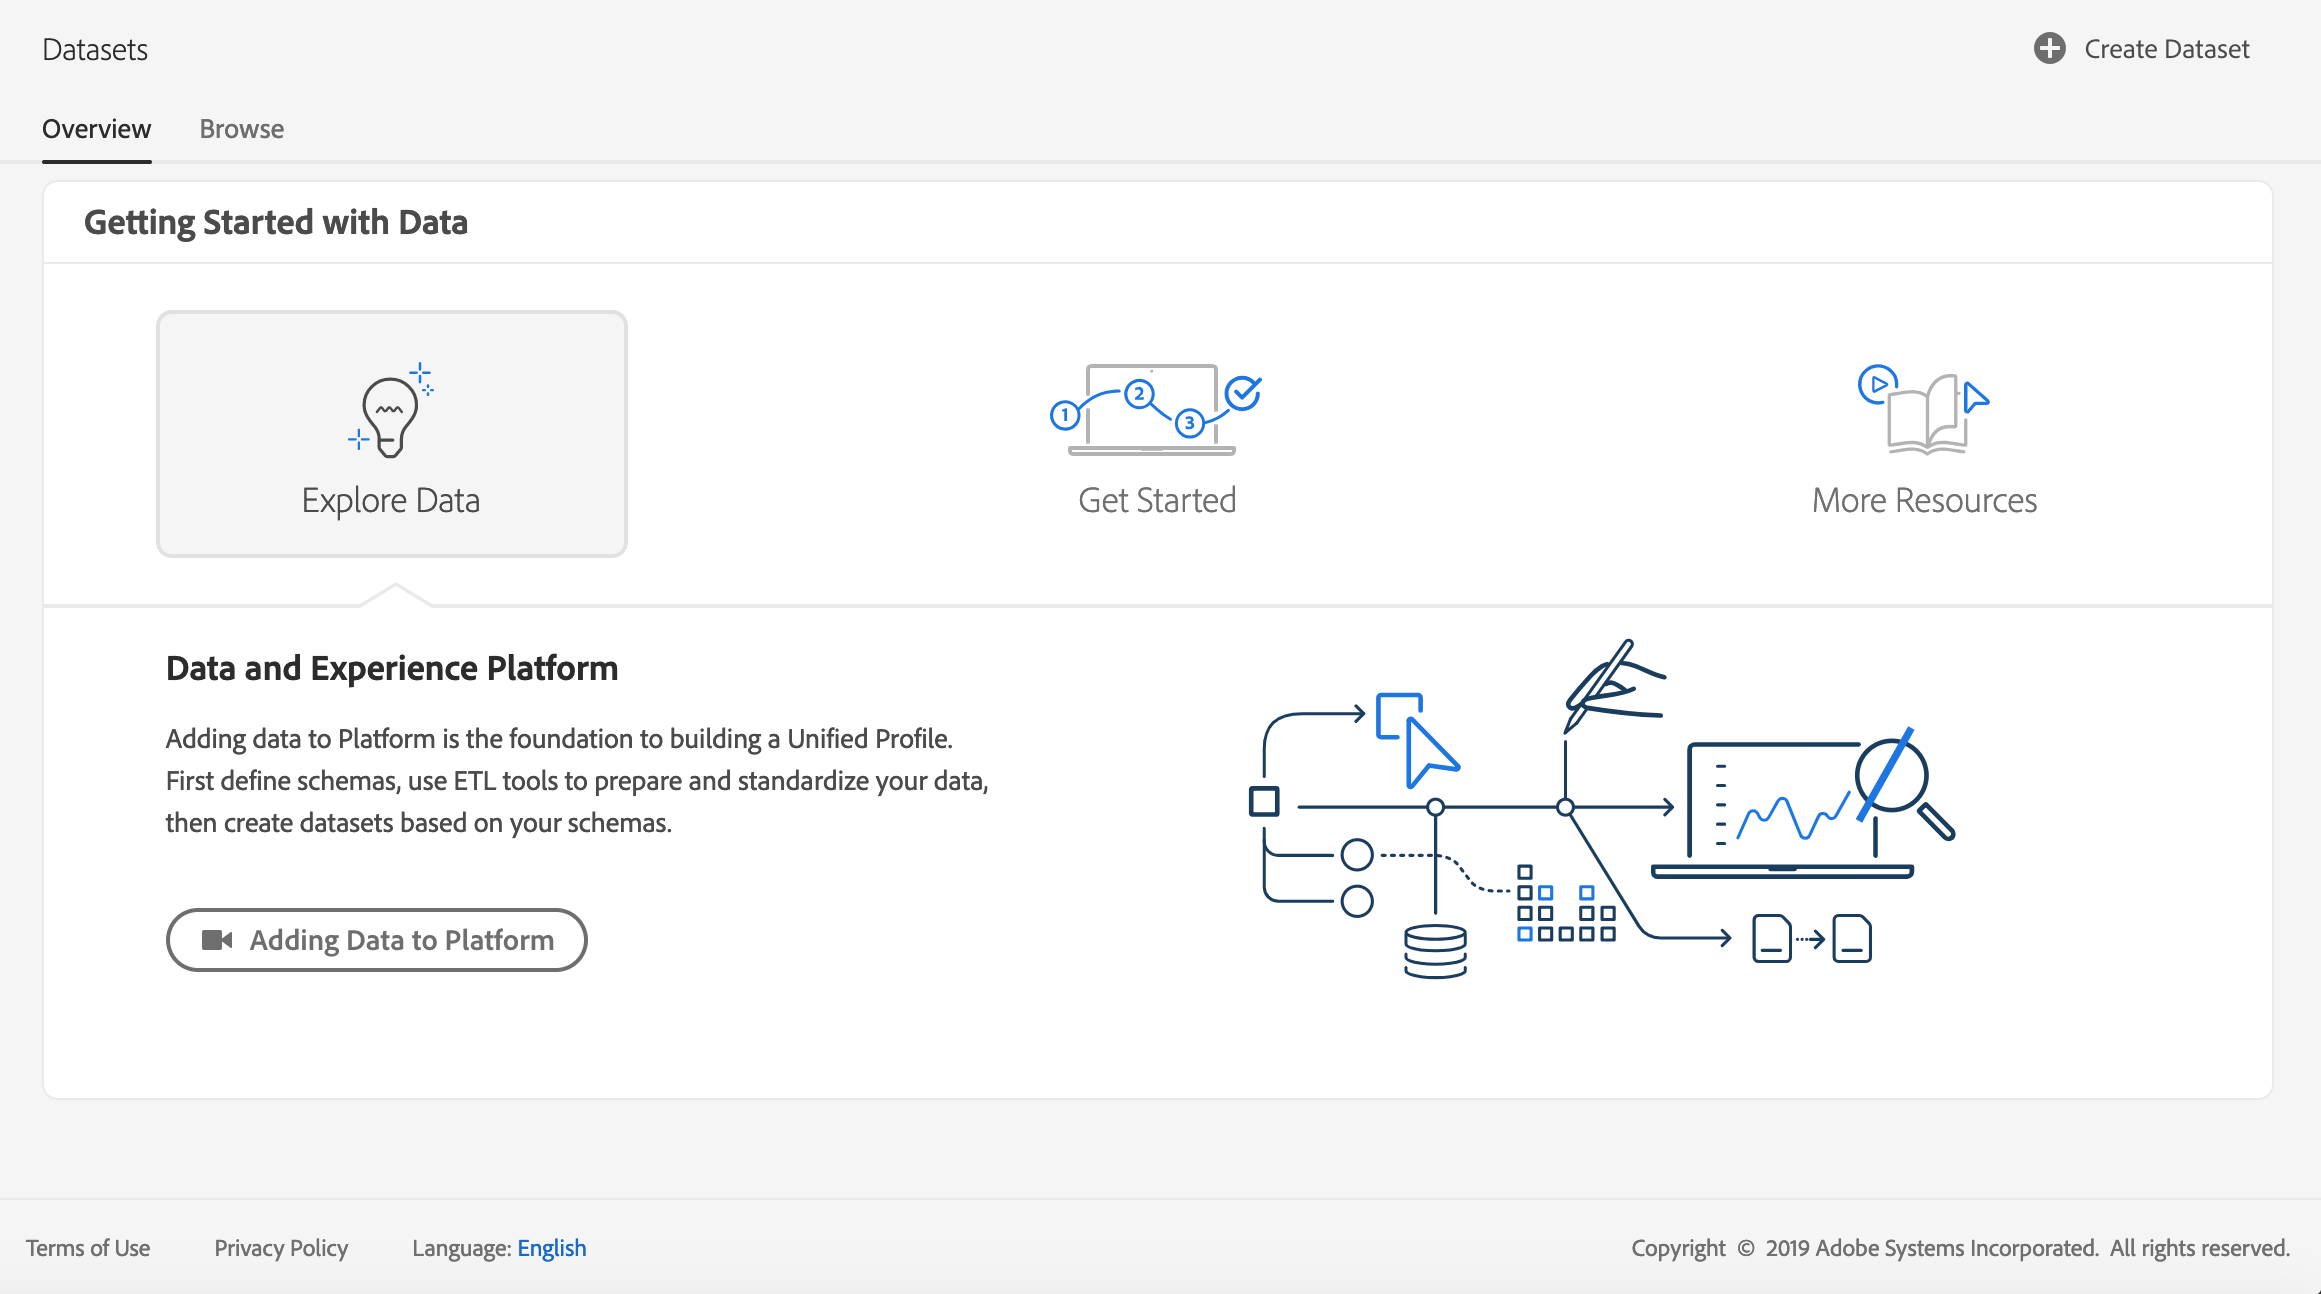
Familiarize yourself with the overall layout of the landing page
(Optional) Browse Learning Resources
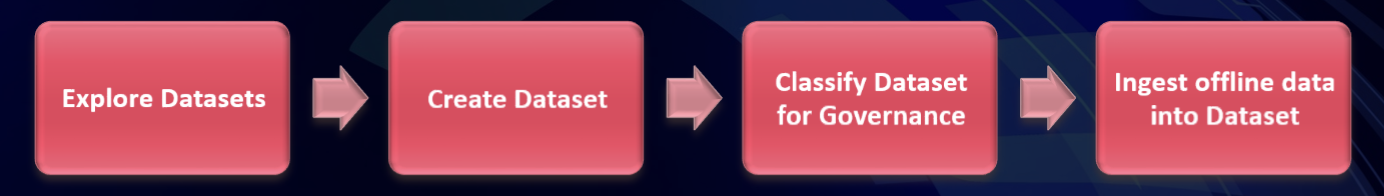
Bringing data from different channels is a tough task for any brand. In this exercise, LUMA customers are engaging with LUMA on its website, on its mobile app, purchase data is collected by LUMA’s Point of Sale system, and they have CRM and Loyalty data. LUMA is using Adobe Analytics and Adobe Launch to capture data across its website, mobile app as well as POS system, so this data is already flowing into Experience Platform. Lets begin with exploring all the data for LUMA that already exists on Experience Platform.
Click on Datasets element in the left navigation panel in the Experience Platform UI
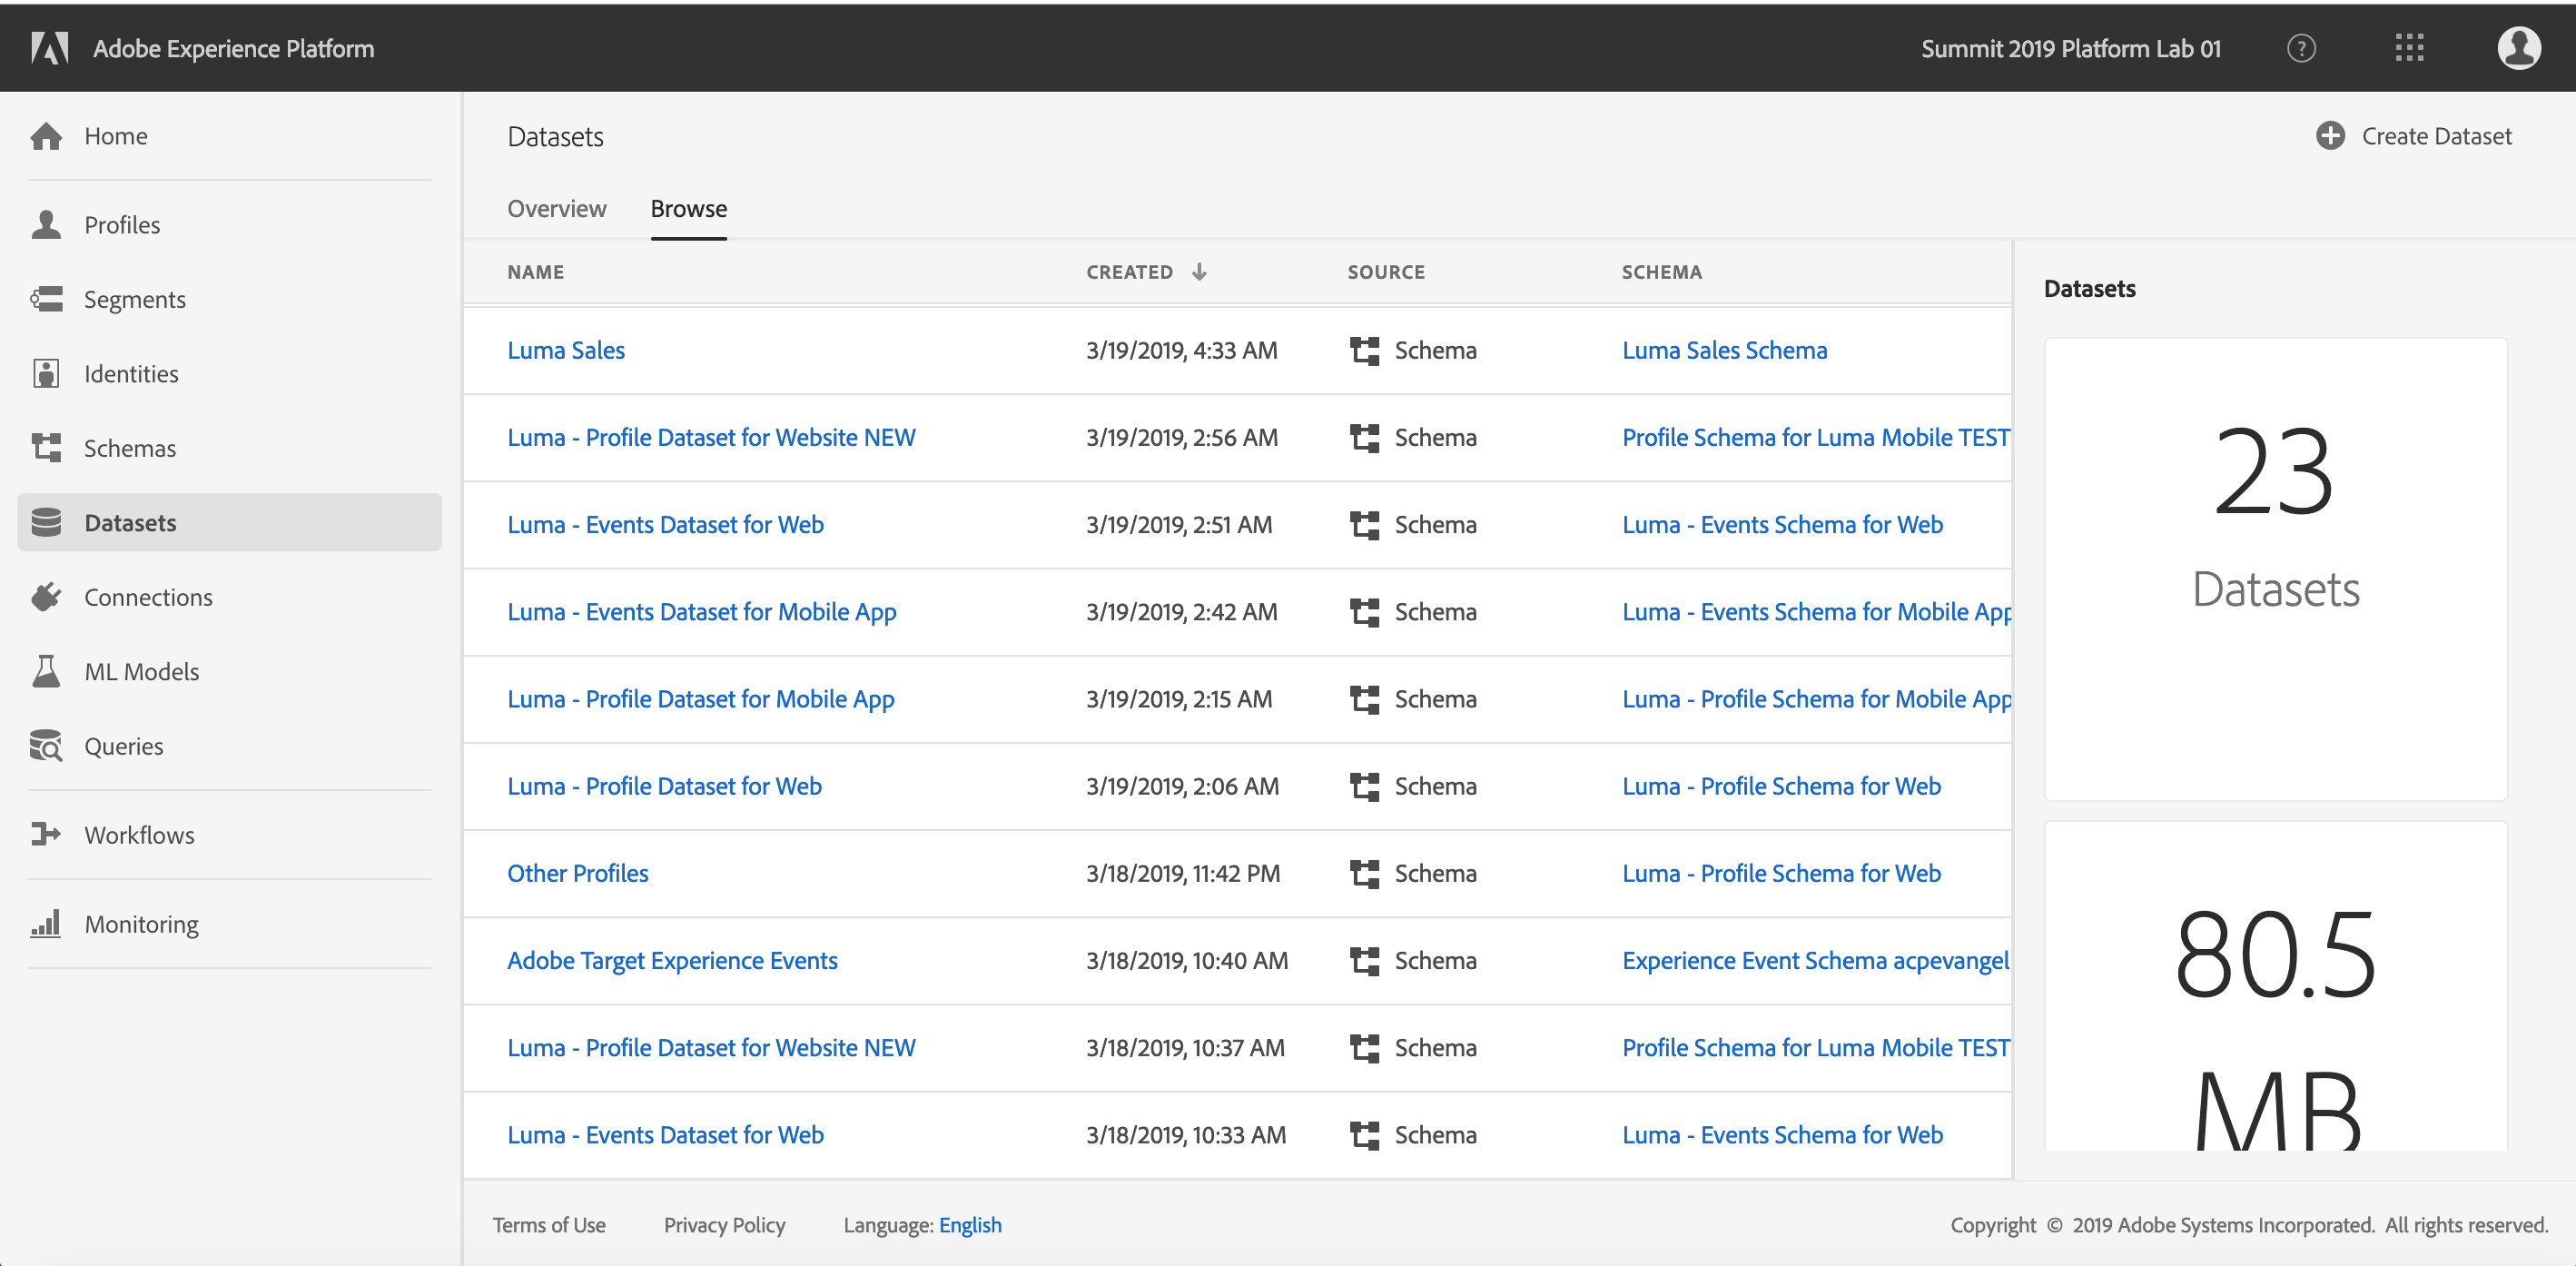
LUMA is using Adobe Analytics to capture web behavioral data. This data is available in Experience Platform in “Luma Global postValues” dataset. Search for “Luma Global postValues”. As you can see the schema for this dataset is “ExperienceEvent”. ExperienceEvent schema is our standard schema to describe time-series events, and works well for web and mobile behavioral data.
Click on the “Luma Global postValues” to get more details on the dataset.
Dataset Activity tab shows the amount of data transferred from Adobe Analytics today and in the Last 30 days. Click on the calendar icon above the metrics to select a different period.
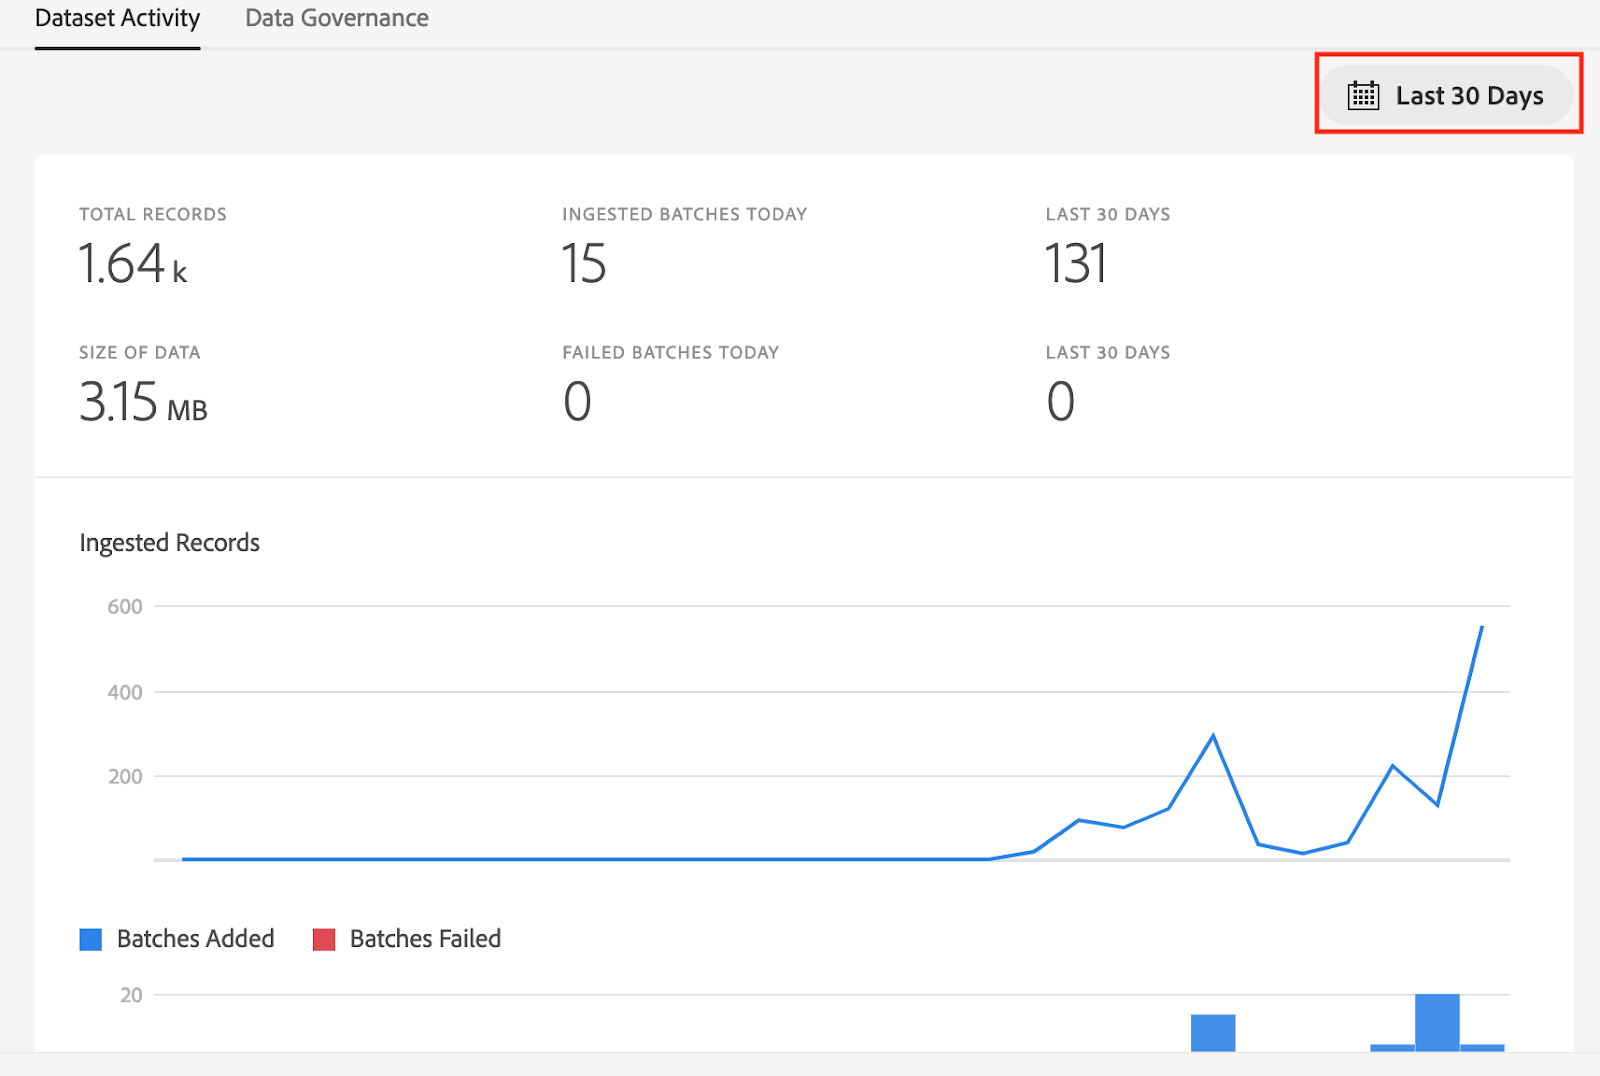
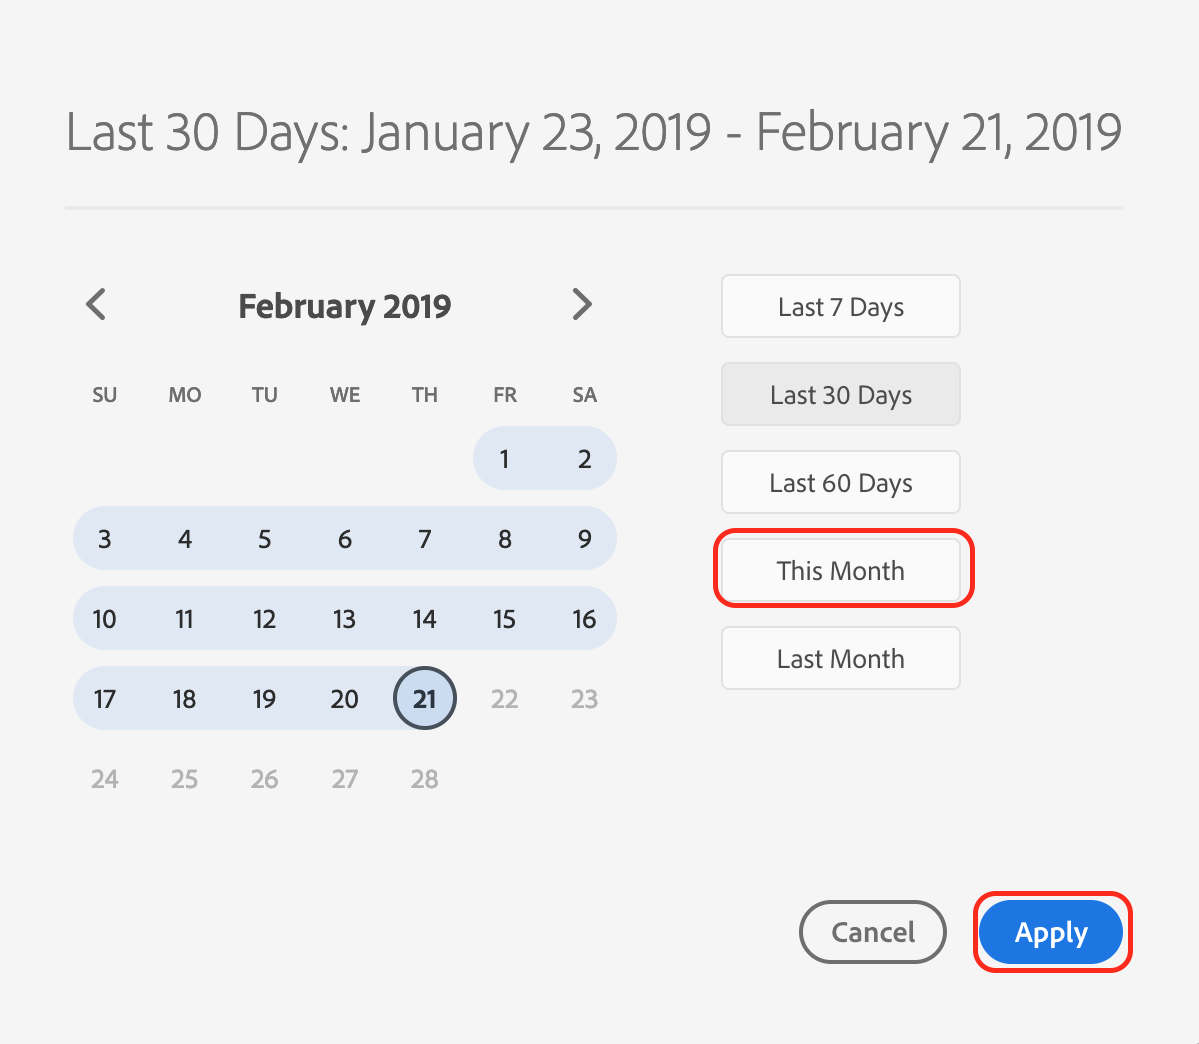
Select “This Month” and click on “Apply”. “Dataset Activity” tab is updated to show metrics for this month.
Go back to list of Datasets by clicking on “Datasets” element in the left navigation panel.
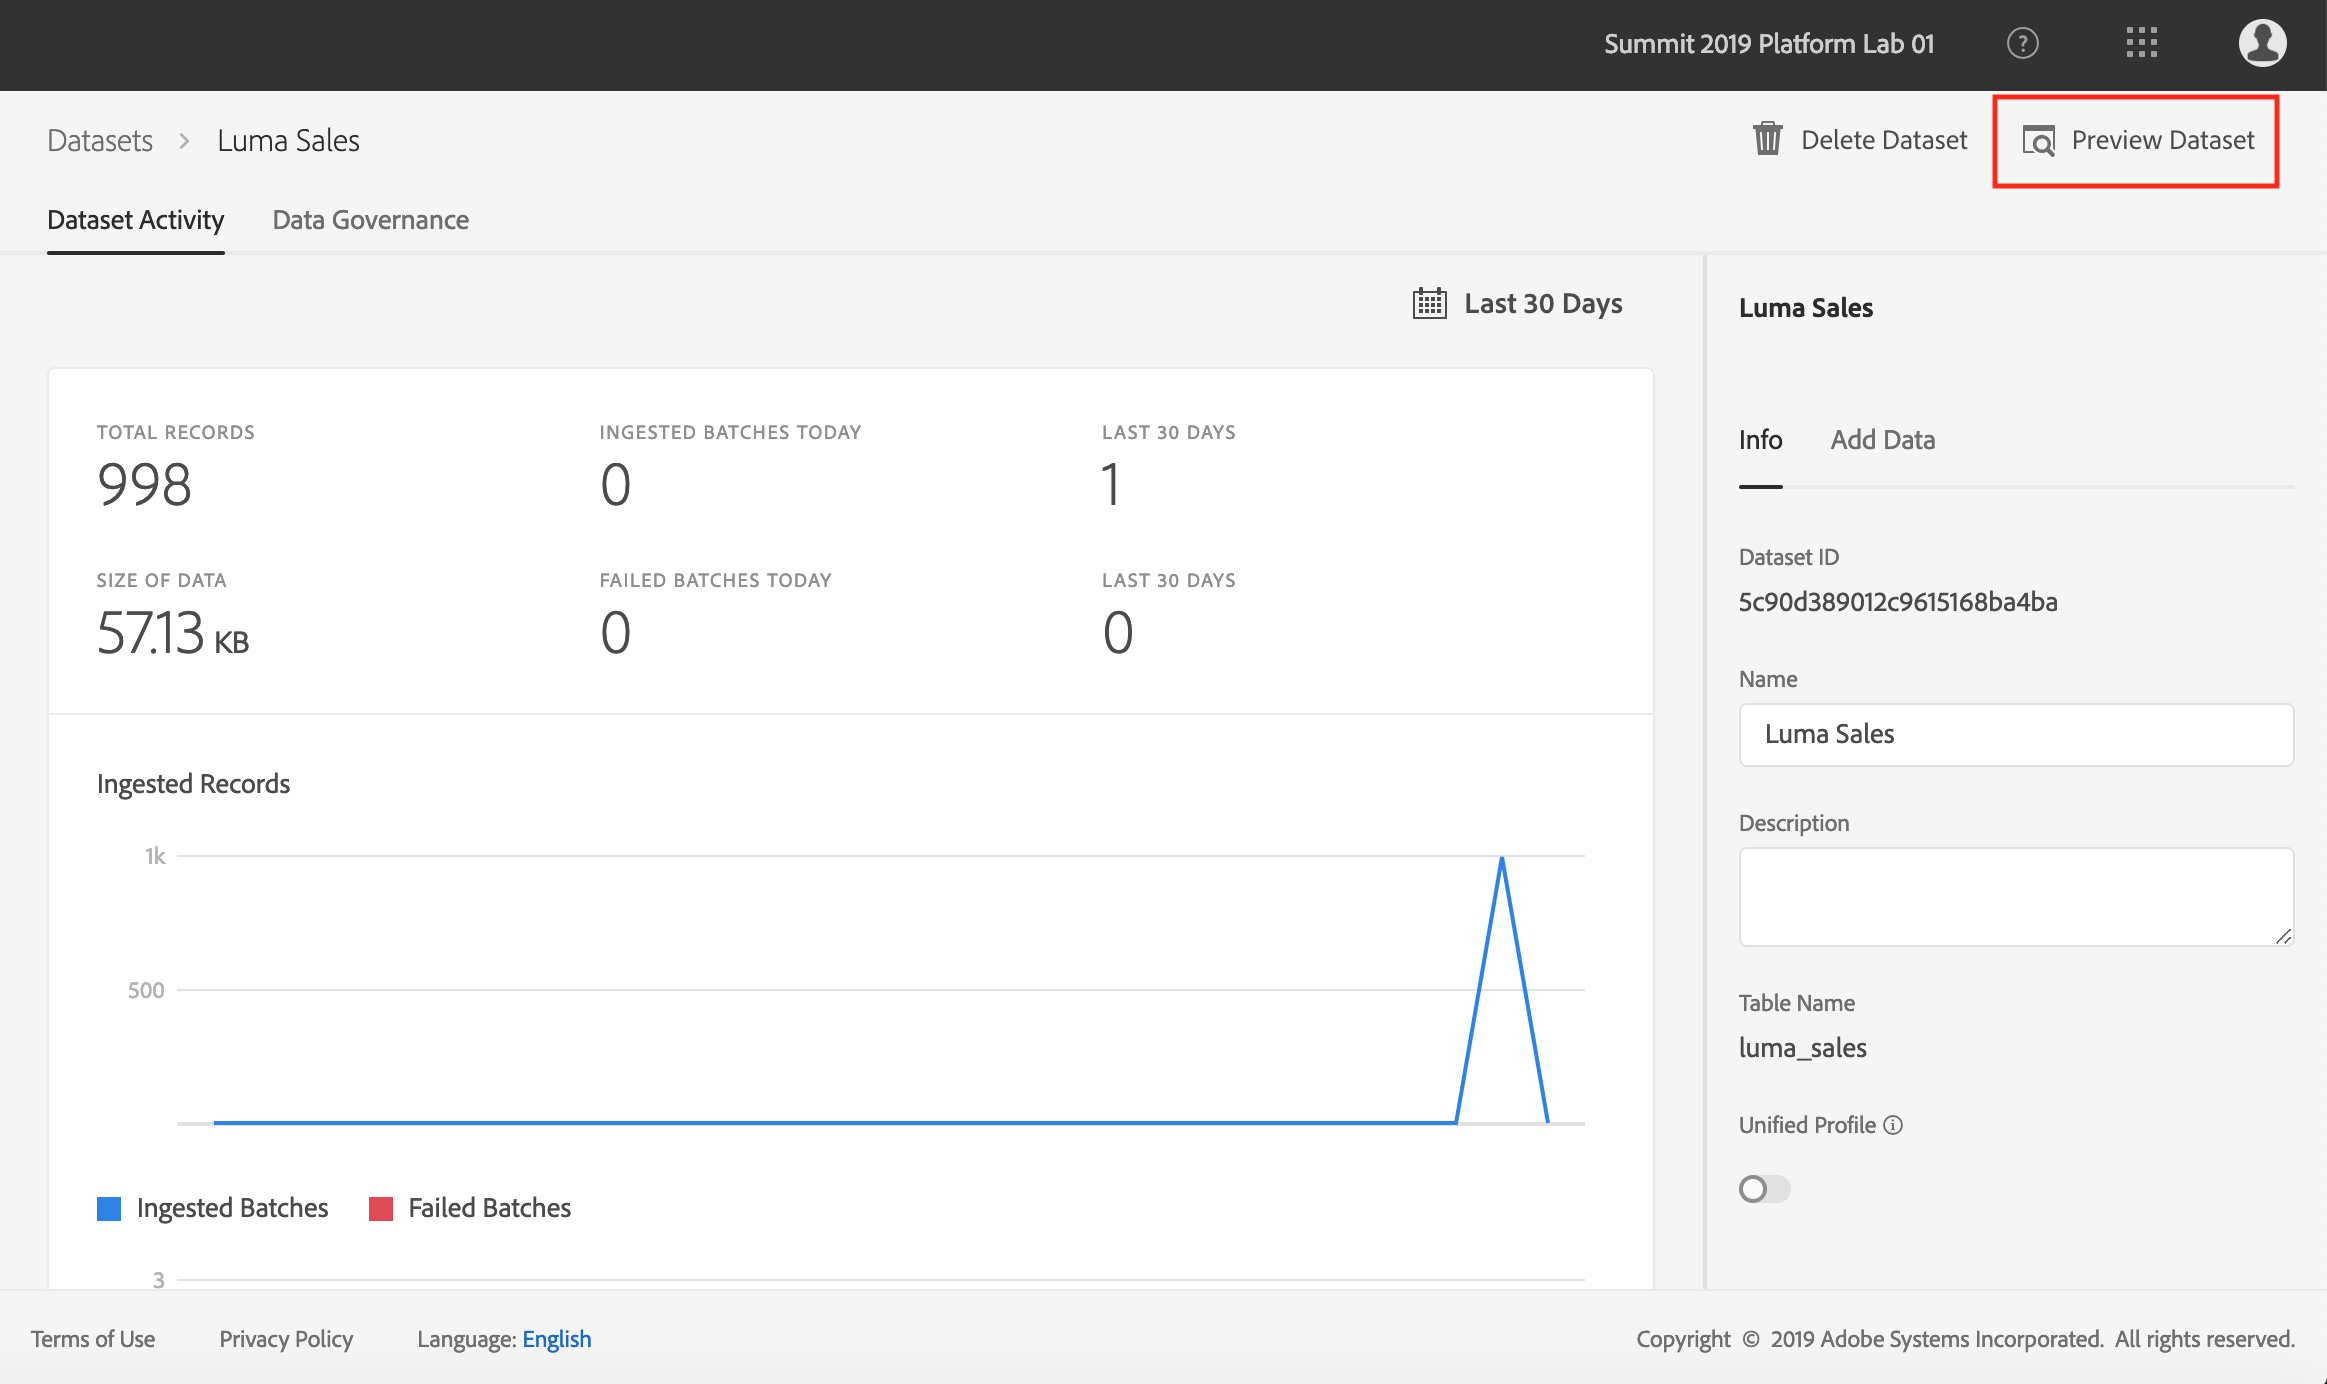
Luma’s POS data is captured in “Luma Sales” dataset. Search for “Luma Sales” data in search box. Click on dataset name to get dataset details.
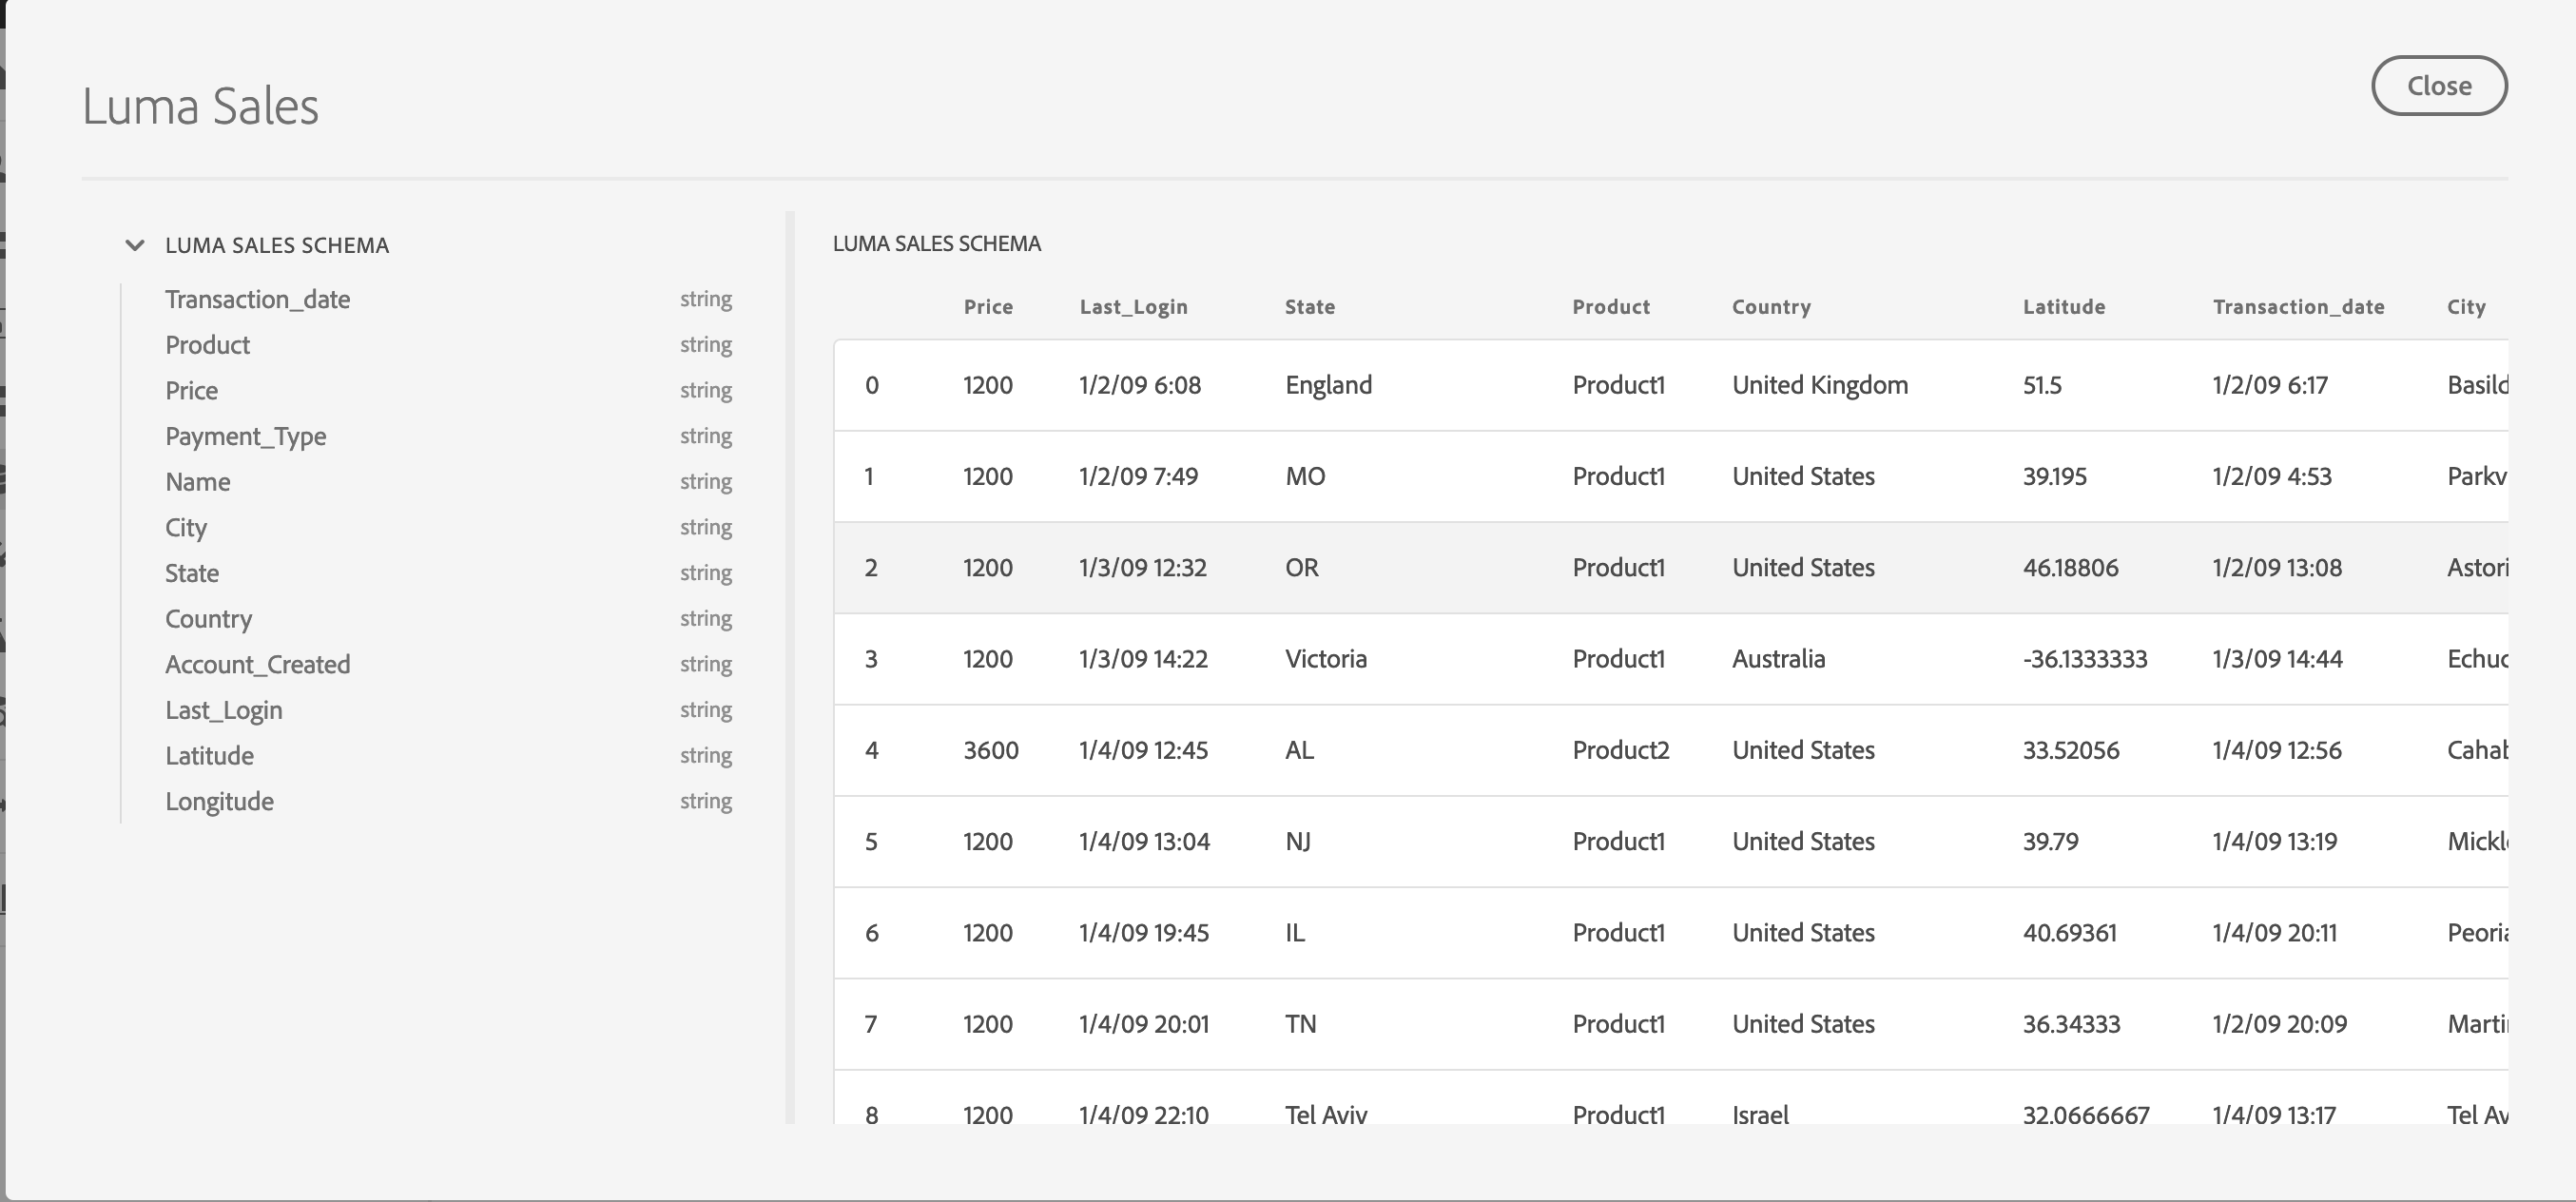
Click on “Preview Dataset” (on the top right corner of the screen) to see a sample of the data stored in “Luma Sales” dataset. Preview shows a sample of the data stored in this dataset. Left panel also shows schema for this dataset.
Go back to list of Datasets by clicking on “Datasets” element in the left navigation panel.
When someone signs up for new account on the Luma website, this sign-up event is captured by Adobe Launch which streams this information to Platform in real-time. These events are available in Experience Platform under the “Luma - Web and Mobile account”. Search for “Luma - Web and Mobile account” dataset and click on the dataset name to get to dataset activity page.
“Luma - Web and Mobile account” dataset includes the customer registration data, which includes first name, last name, email address, Experience Cloud ID, and CRM ID. This dataset contains sensitive data about customers, so let's ensure we setup labels for Data Governance. Click on Data Governance tab in the dataset detail view. The dataset already has a contract label C2 applied to it to protect this data. The C2 label means “Data cannot be exported to third parties”.
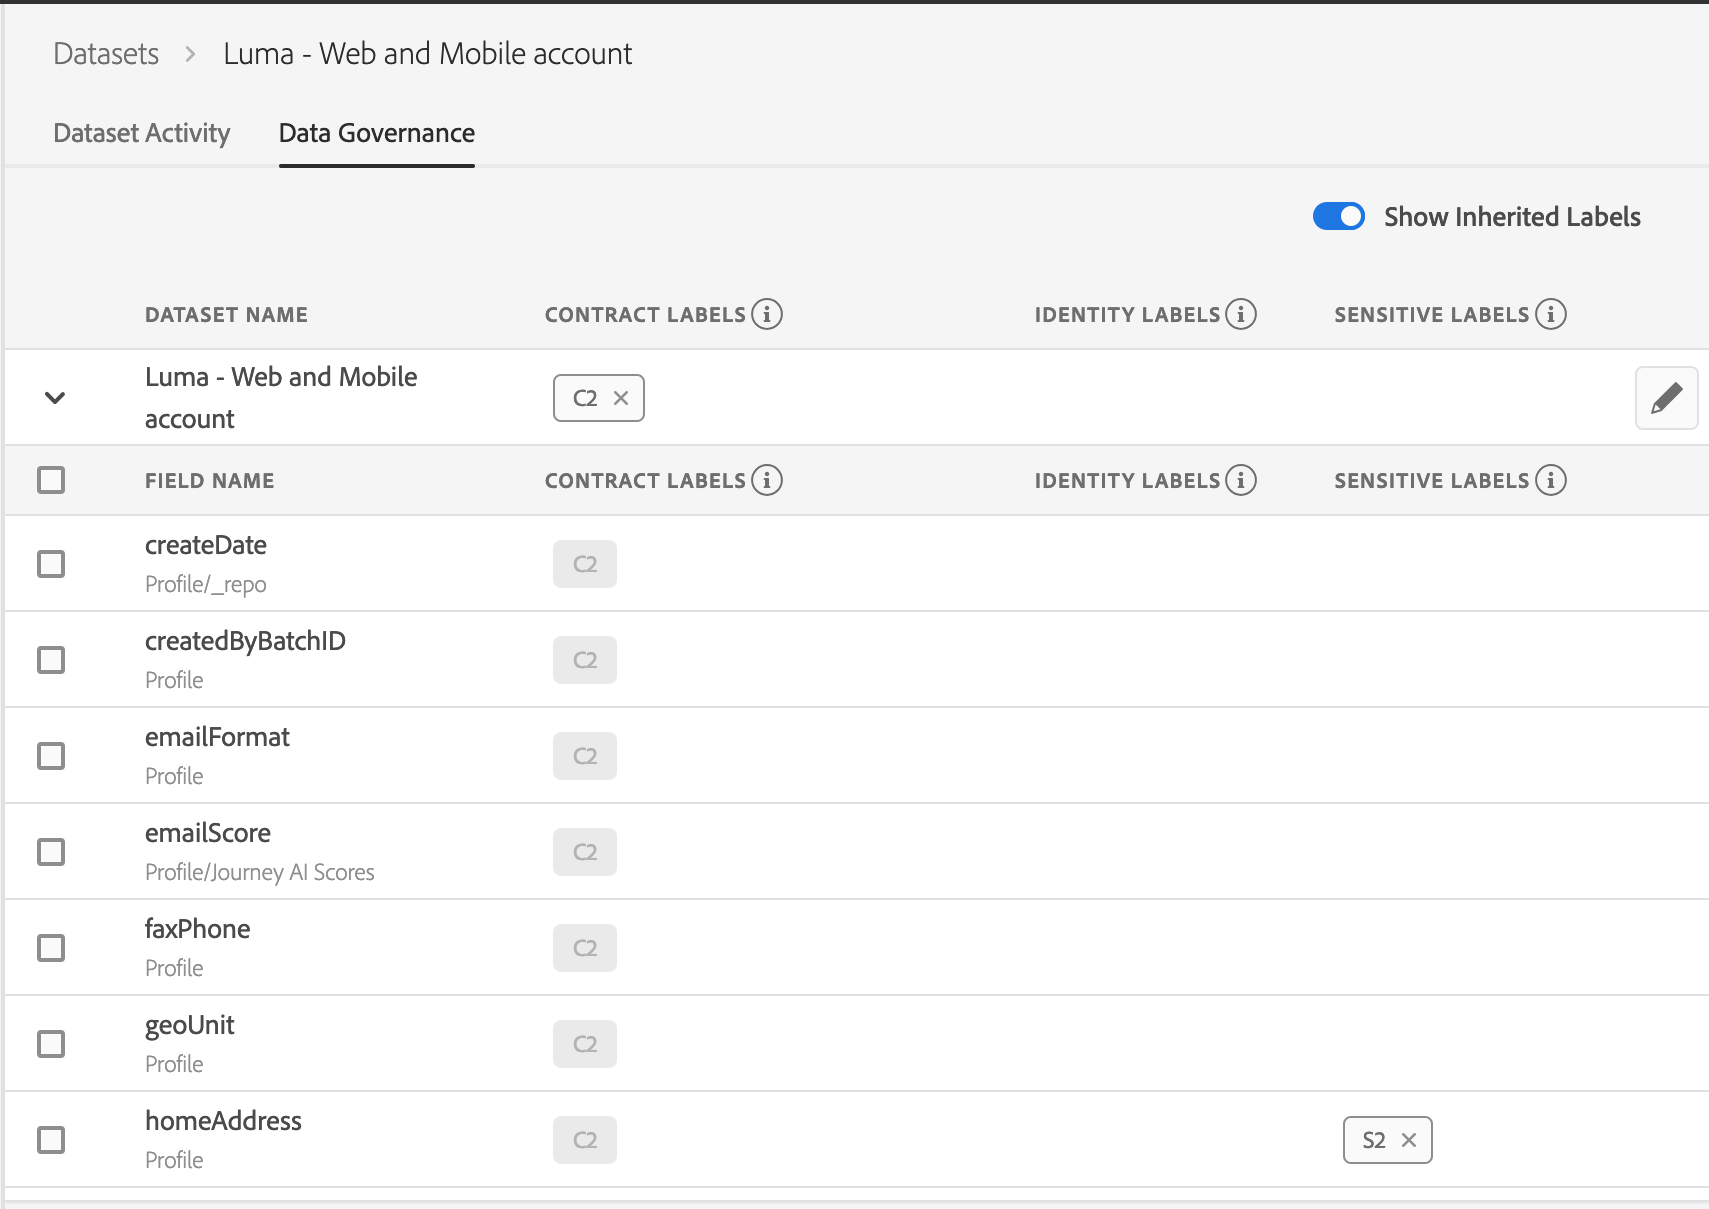
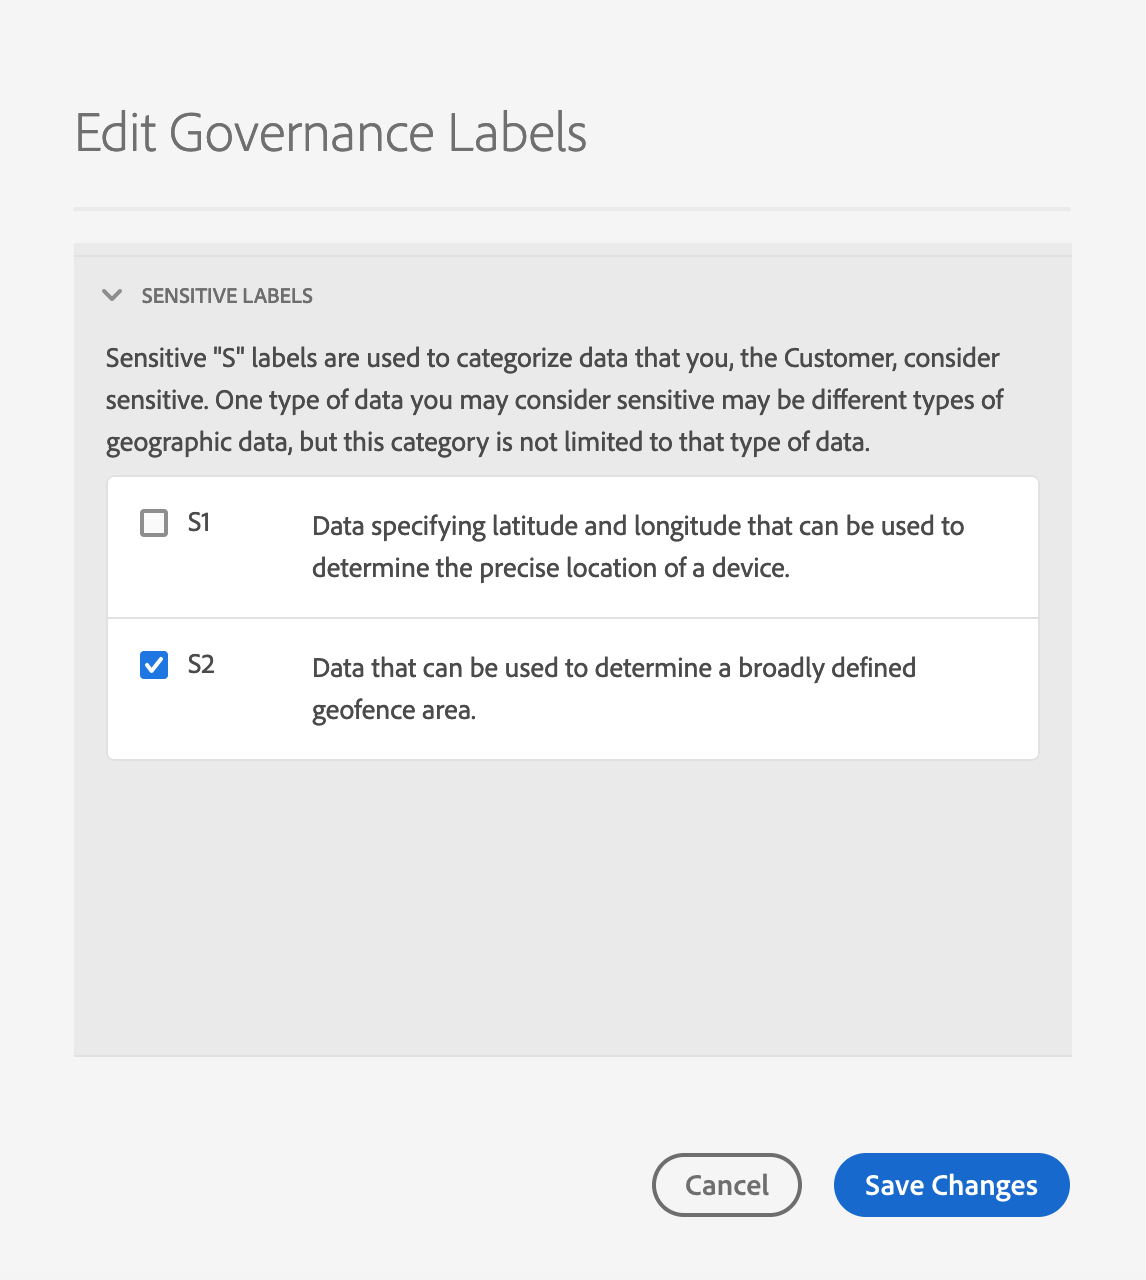
Look for the “homeAddress” field, click on the checkbox next to it and click on “Edit Governance Labels” option in the right panel.
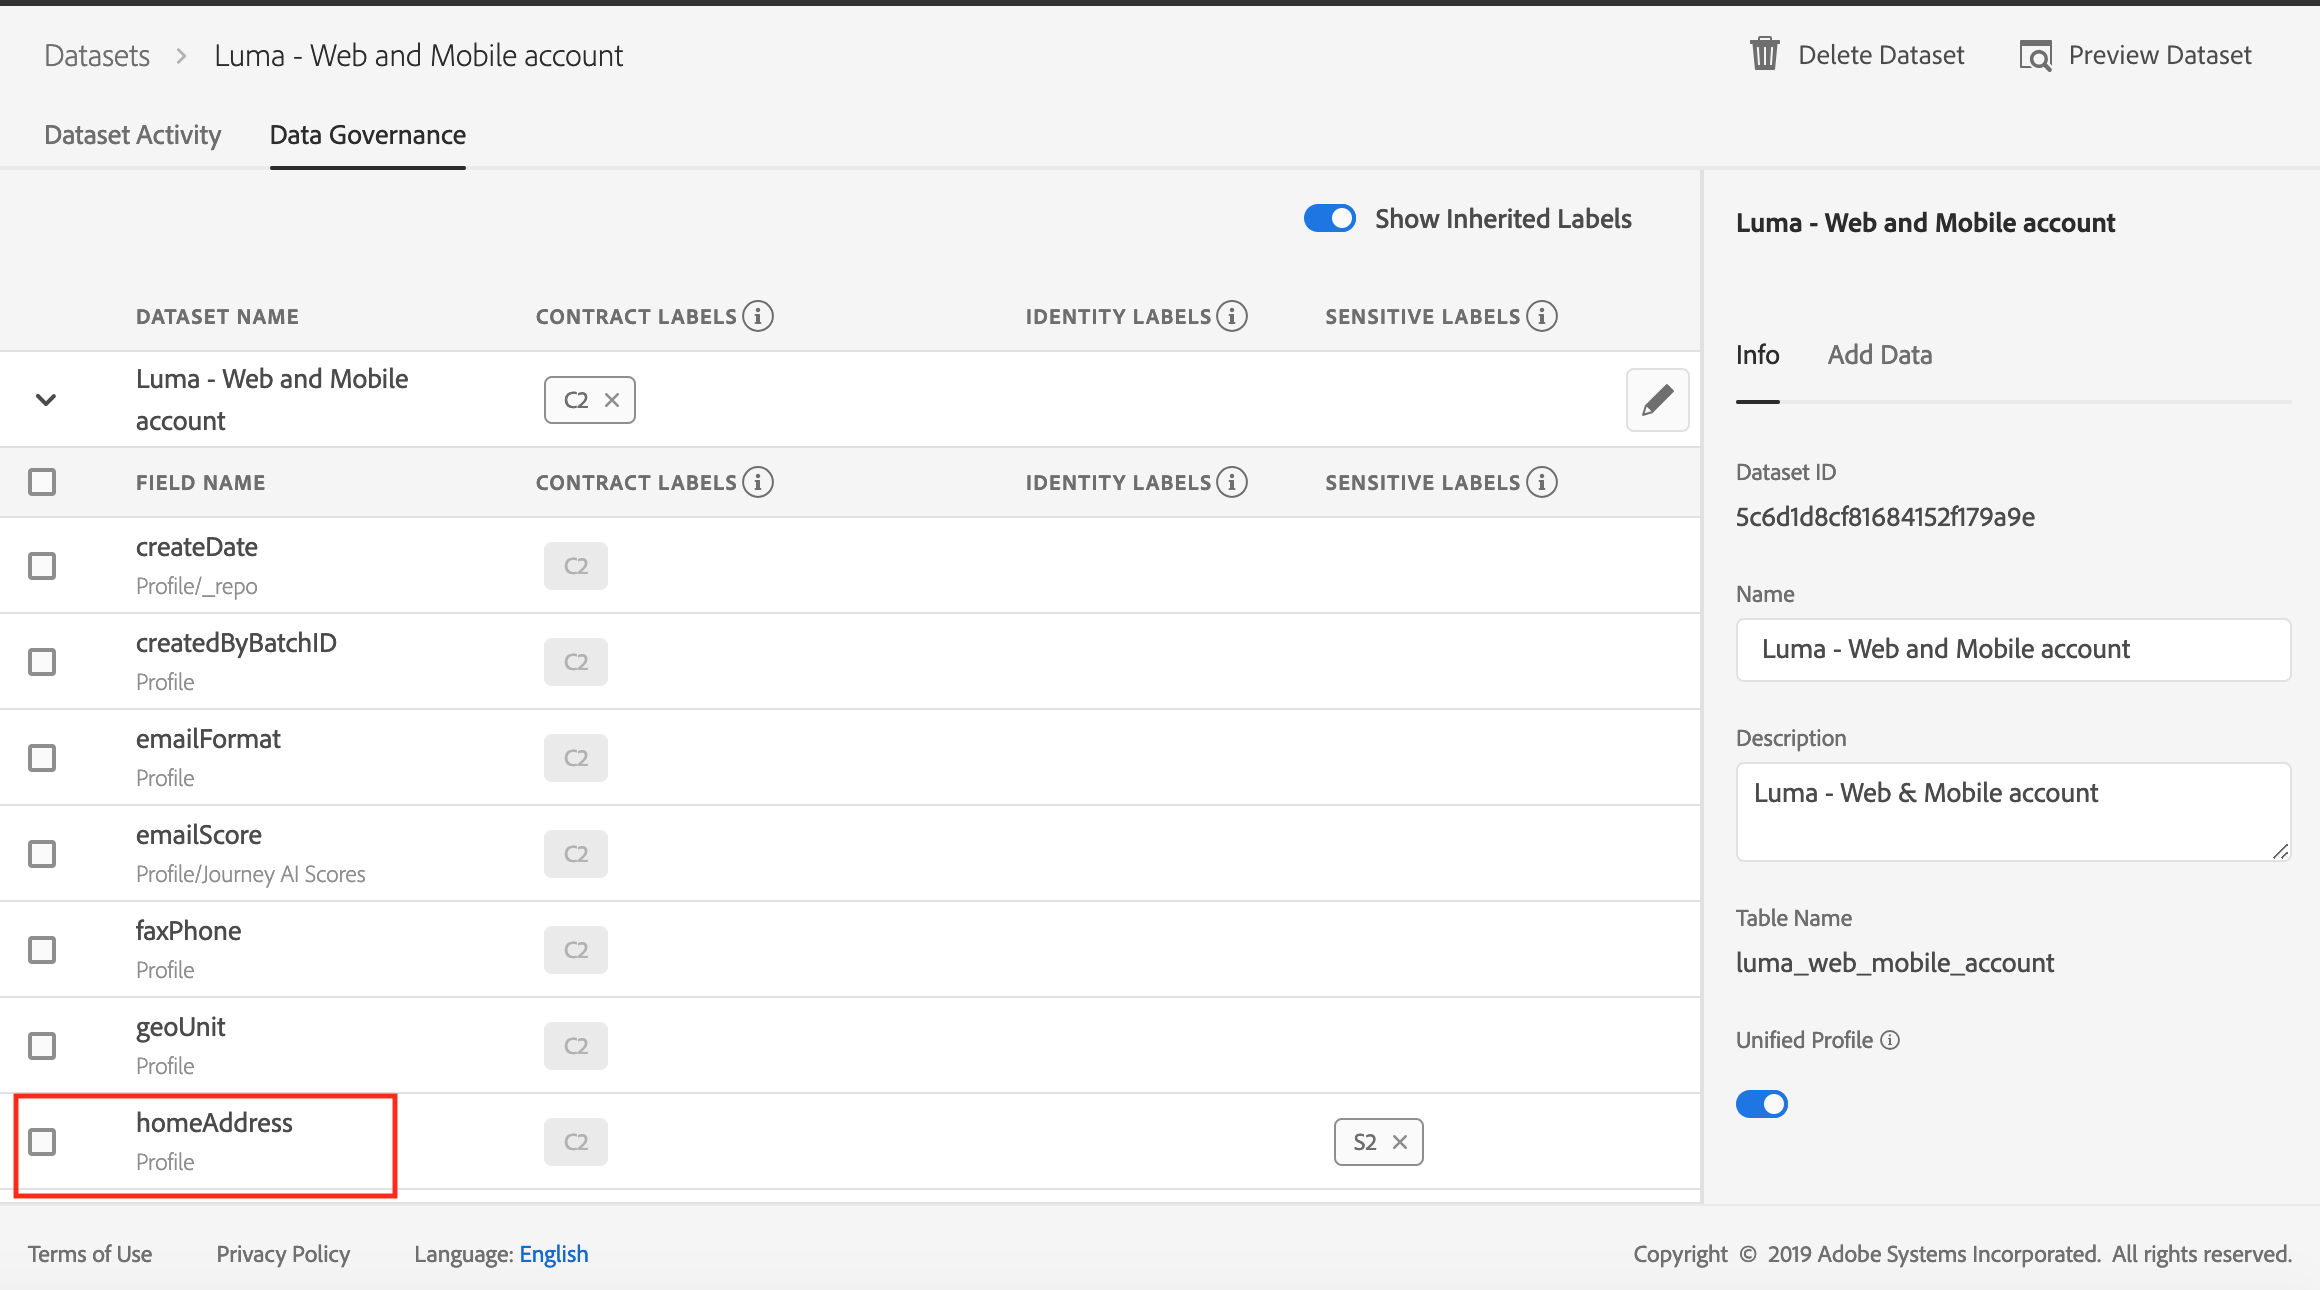
Expand the Sensitive Labels section and check the box next to label “S2”. Save Changes.
So far we have looked at the data which Luma captures using tools provided by Adobe. But LUMA, like every other brand, has other data about its customer that they want to use to deliver the right experience at the right moment to delight their customers. Luma has loyalty data about its customers which they want to onboard onto Experience Platform and enrich their profile.
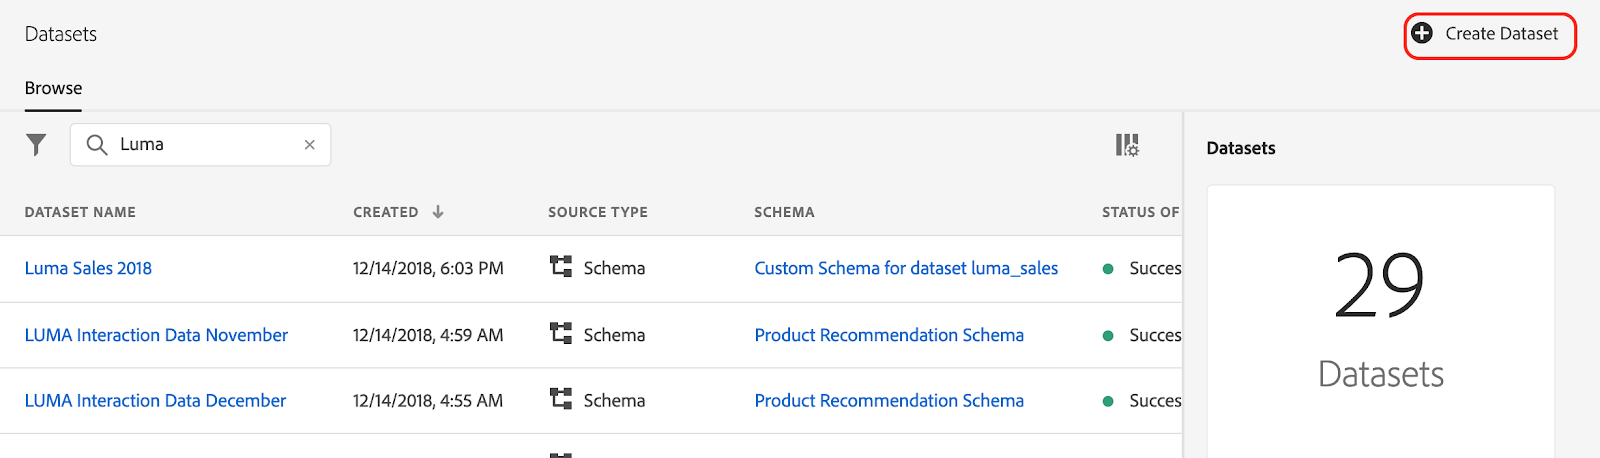
To create a new dataset, click on the “Create Dataset” button on the top right hand corner of the dataset screen.
Select “Create Dataset from Schema” and search for “Loyalty” schema. Loyalty is a schema that we have customized for LUMA. We have added Loyalty fields to this schema. Click Next.
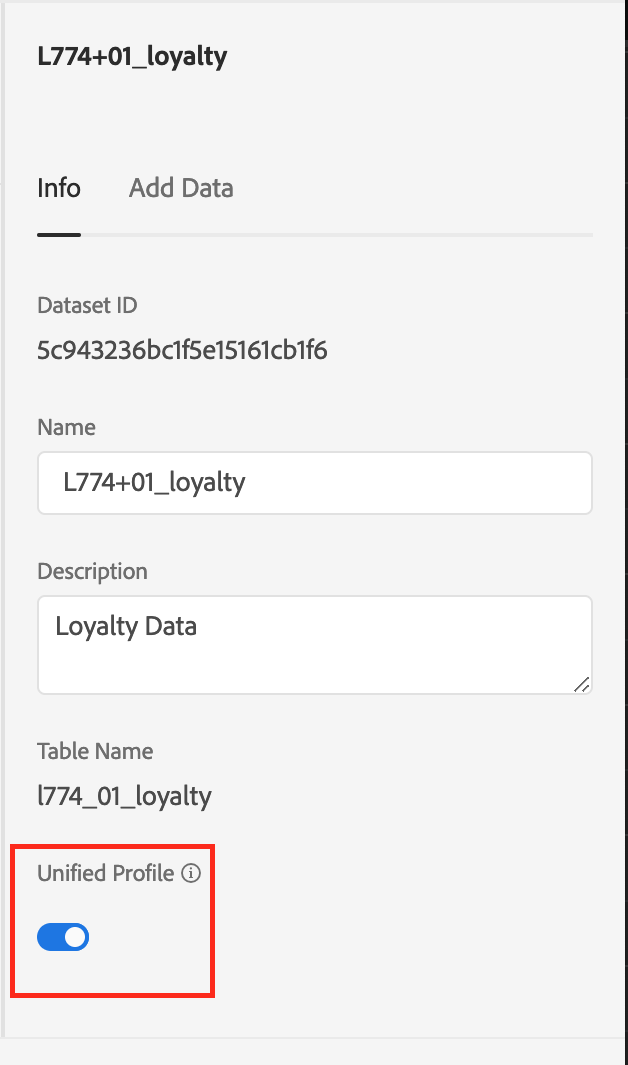
Provide a Name and Description for the dataset. Name of the dataset should be userid_loyalty. For example: L774+01_loyalty. Select the finish button to save the dataset.
Search for the dataset you just created and click on the dataset name.
Enable the dataset for Unified Profile. To enrich Unified Profile with data in a dataset, it is critical to mark it enabled for Unified Profile. In the right panel of the Dataset Activity page, toggle the "Unified Profile" button.
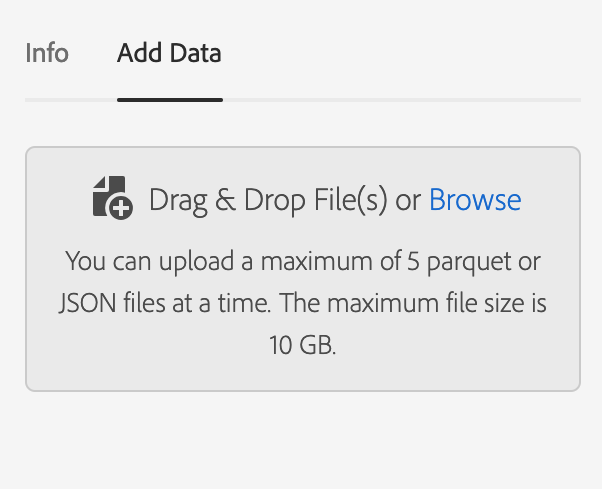
Next we will add data to this dataset. Batch data can be added to Experience Platform in either JSON or Parquet format. For this exercise we have provided a sample json file with the data. Download the file in this location: http://bit.ly/Lab774-data and save to your desktop.
Click on the “Add Data” tab in the right panel of the screen. Ingest data into your dataset by uploading the provided file “Lab774-sampledata.json” into the add data part of the screen.
Once the upload is complete you should see 1 batch which will show up as in progress
Wait for the batch to complete processing. Once the batch has been successfully uploaded click on the "Preview Dataset" button to preview the dataset ingested
View real-time customer profiles in Experience Platform and define segments to create Audiences for campaign and to drive customer experiences

Unified Profile offers brands a true single view of their customers, while keeping a large focus on consumer privacy and security. Brands will now experience a single, integrated segmentation experience across all Adobe Experience Cloud solutions. A segment will be built once, based on the Unified Profile, and the same segment can be activated across all of the Adobe Experience Cloud solutions.
In this lesson we will look up the profile we just enriched using loyalty data and build a segment for customers with platinum status.
Let's start with going to the home page in the Experience Platform UI.
Click on Profiles element in the left navigation panel of the UI
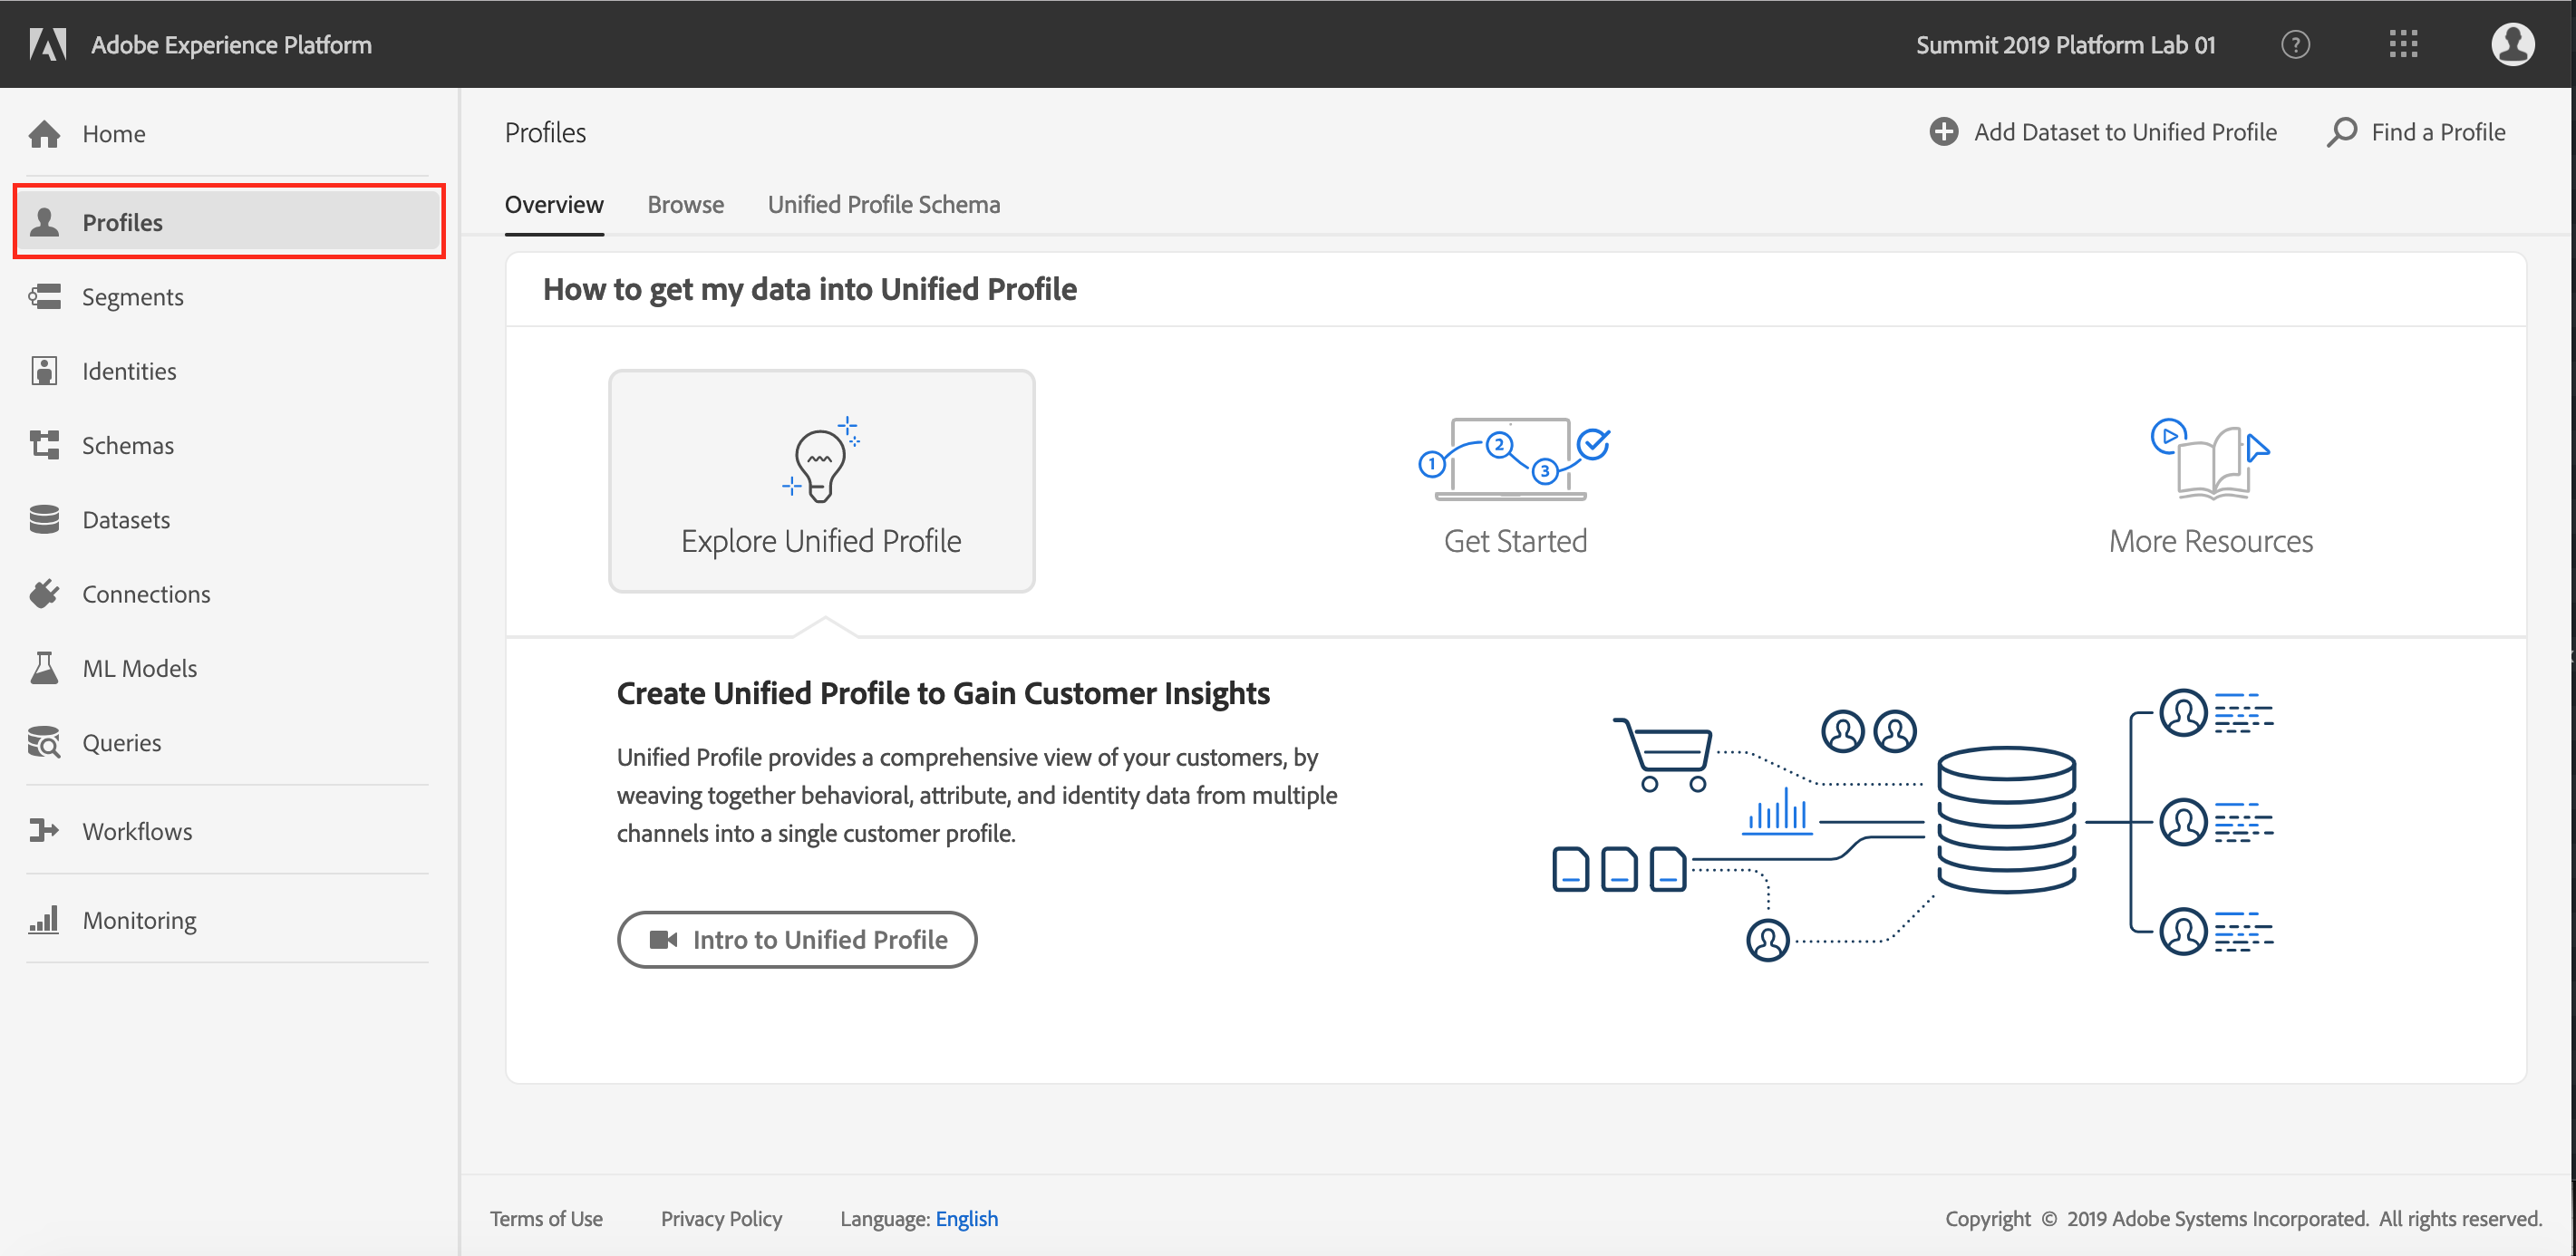
Unified Profile combines all the Profile and ExperienceEvent data to build a real-time view of the customer. To see all the different profile schemas that are part of the Profile, click on the Unified Profile Schema tab.
This tab shows all the different attributes that are captured in Unified Profile for LUMA.
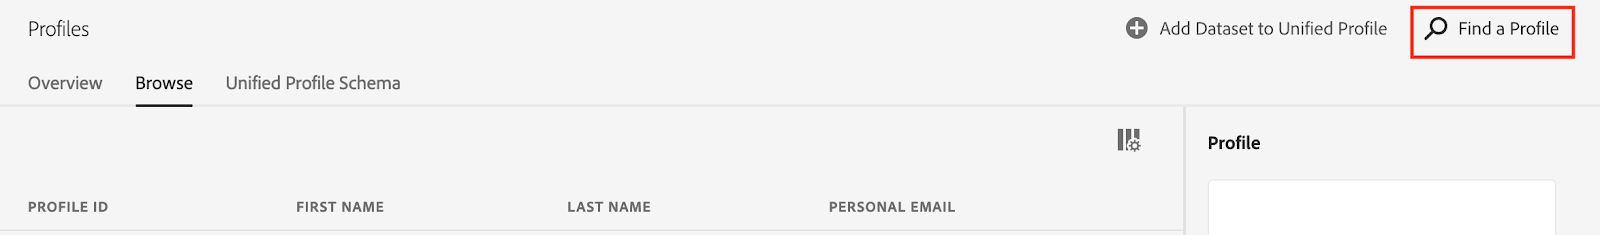
Look up profile. Next click on Browse tab. This tab shows you a list of all the profiles stored in Unified Profile . To lookup an individual profile, click on “Find a Profile” button on the top-right hand corner of the screen.
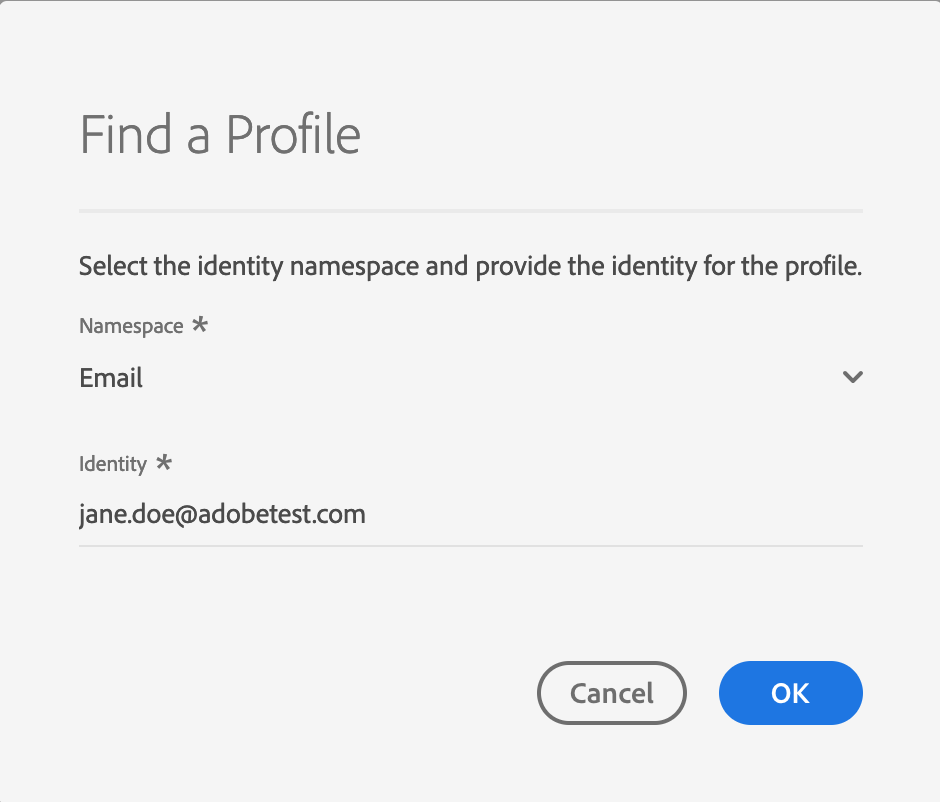
Unified Profile allows searching for profile using any of the identities used by the brand. In this instance lets search by email address. In the "Namespace" drop down, select “Email” from the list of Namespaces and in Identities use the email “jane.doe@adobetest.com”
Details page shows all the information Unified Profile has about this profile including their preferred channels for communication.
Luma would like to create a segment of its most loyal customers in Oregon so that they can be targeted for the best offers for the season. In this case lets build a segment of all customers with a Platinum level in loyalty system.
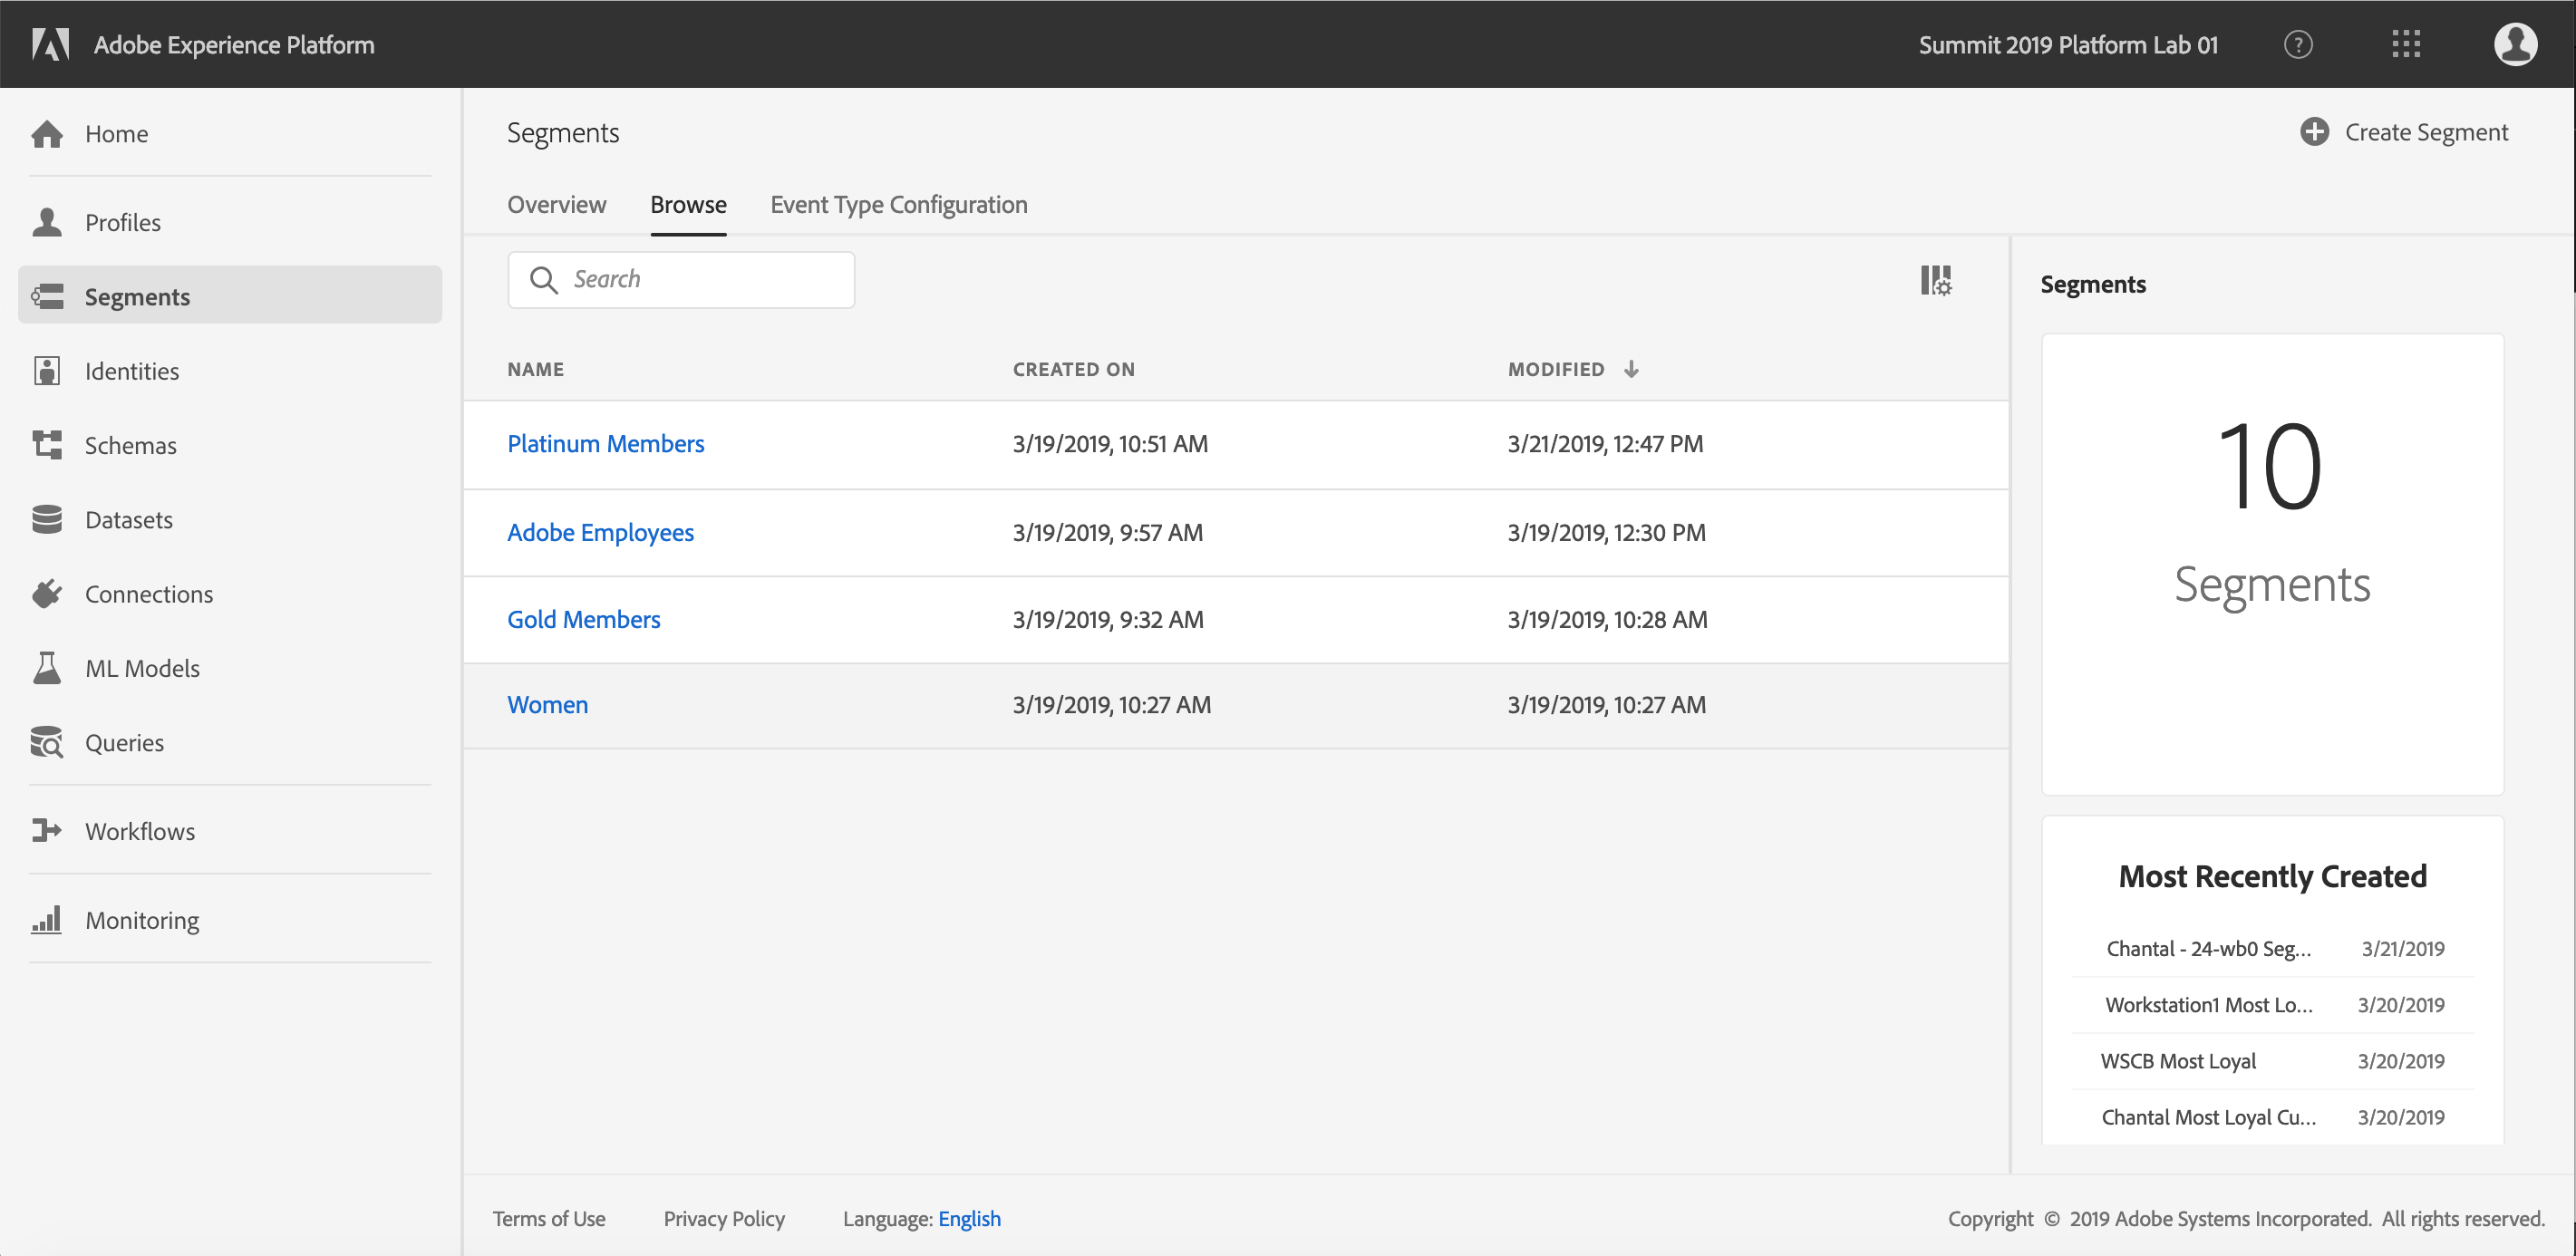
Click on Segments elements in the left navigation panel. Browse tab shows a list of all segments already created. Right panel shows total segments in the system and the most recently created segments.
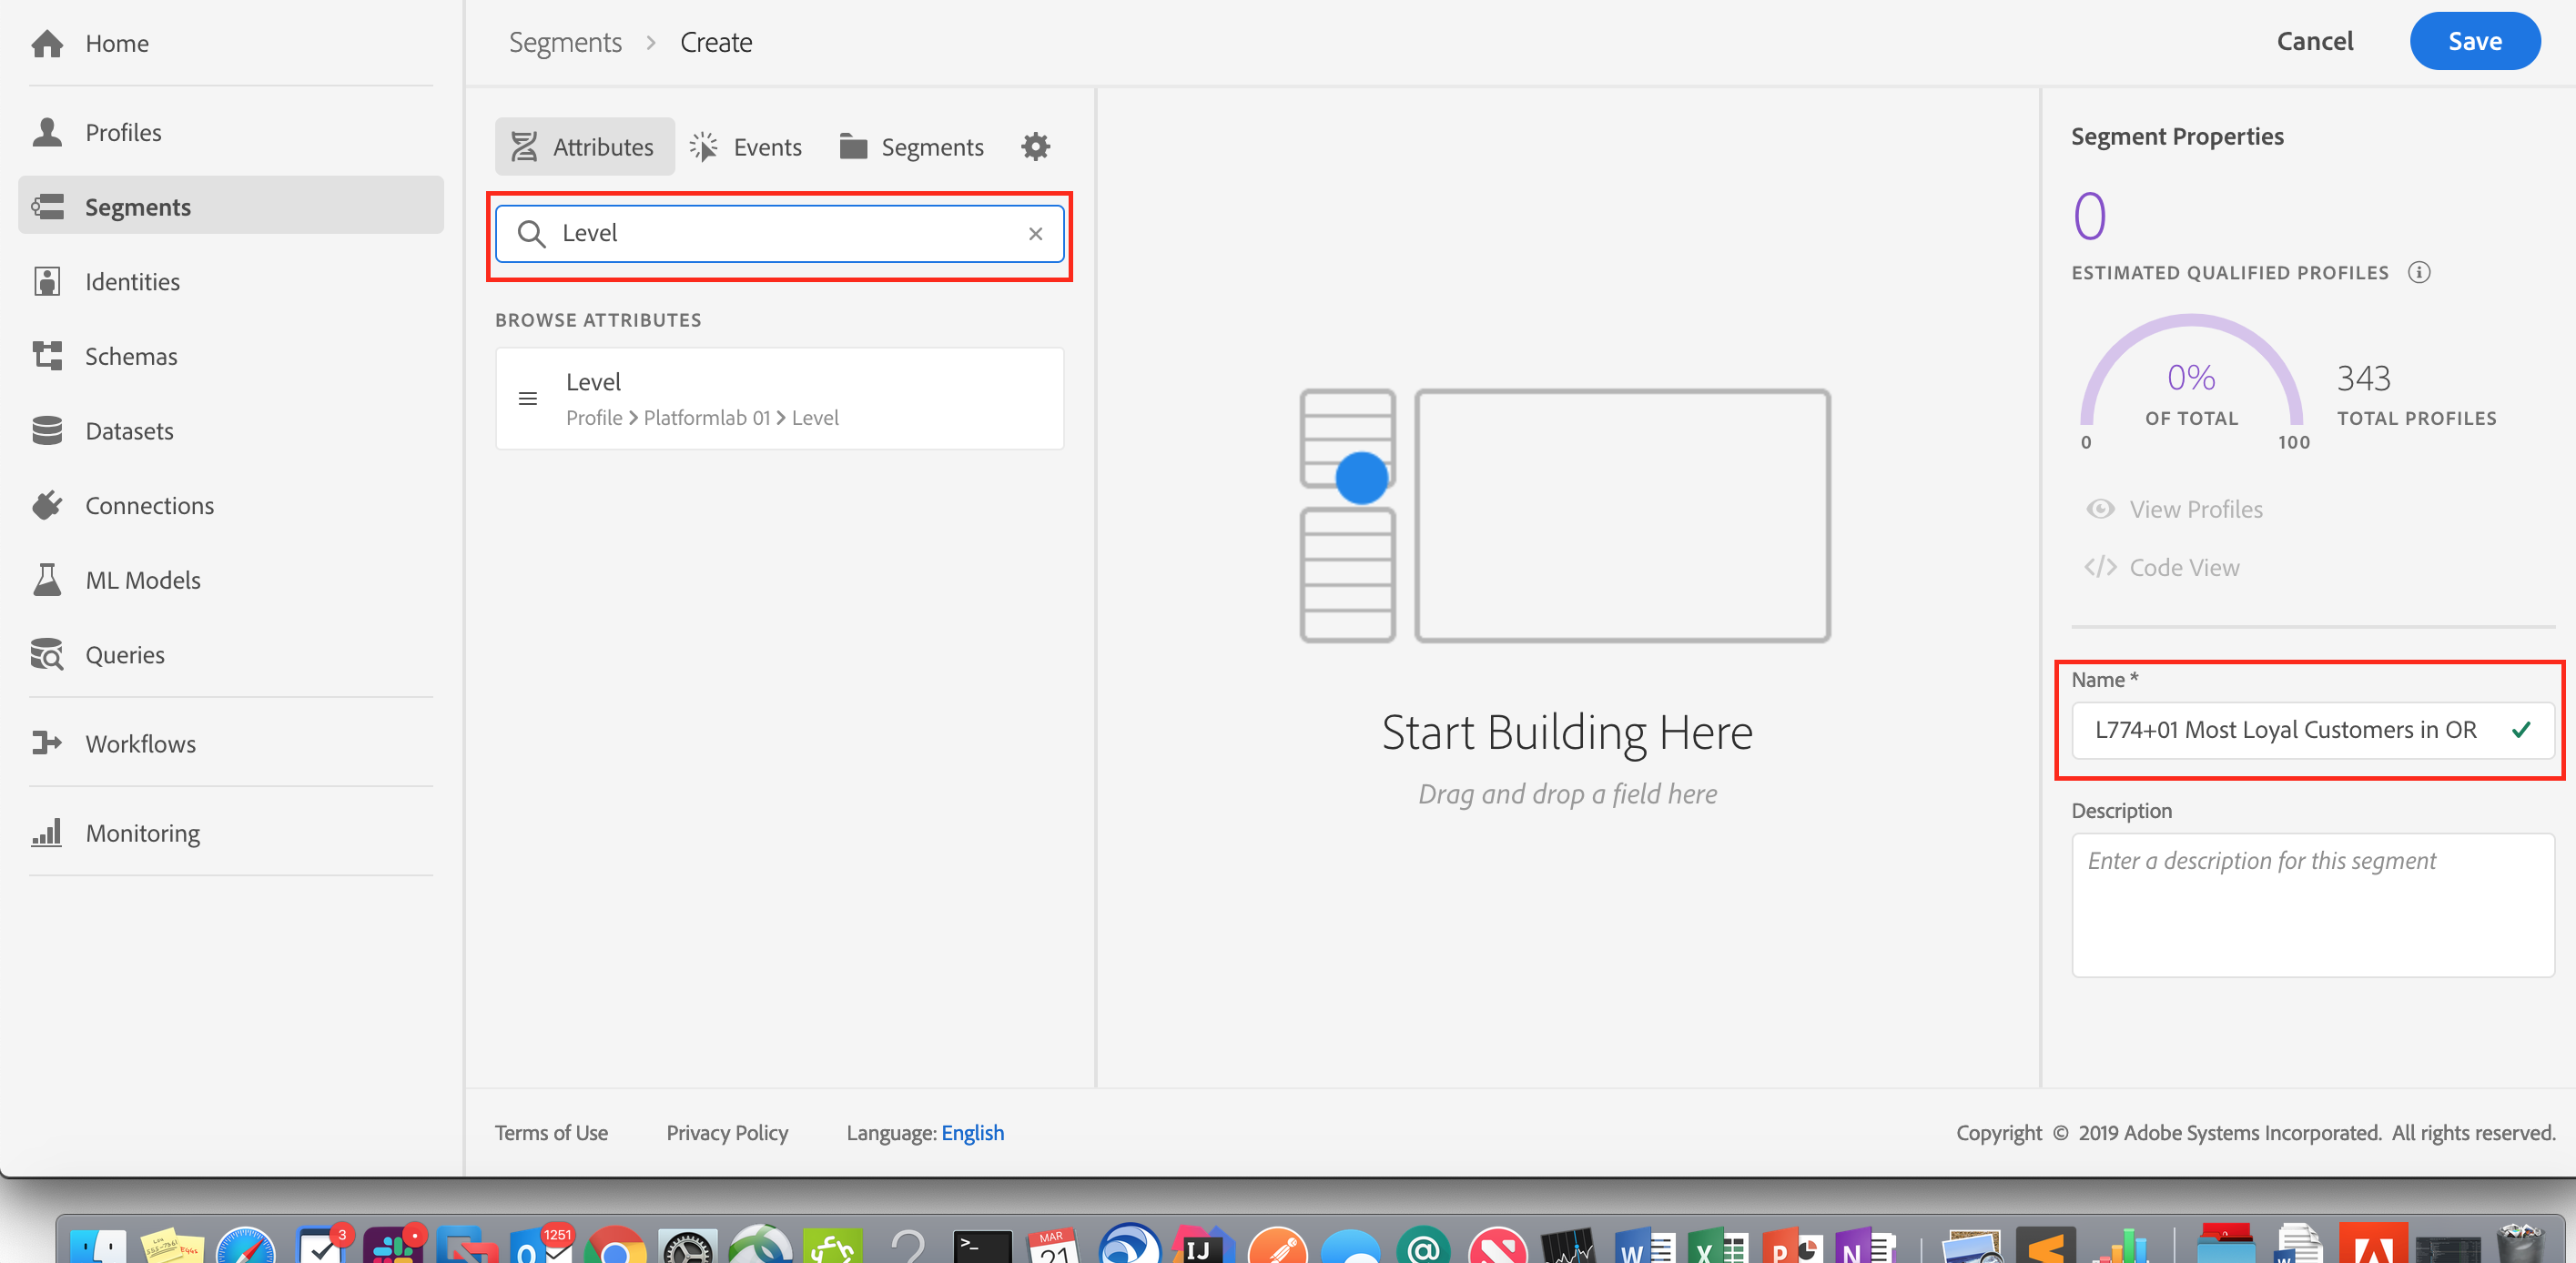
Select "Create Segment" in the upper right corner to create a new segment.
In the Segment name, give the segment a unique name, userid. For example “L774+01 Most Loyal Customers in Oregon”. In the search attributes, search for Level.
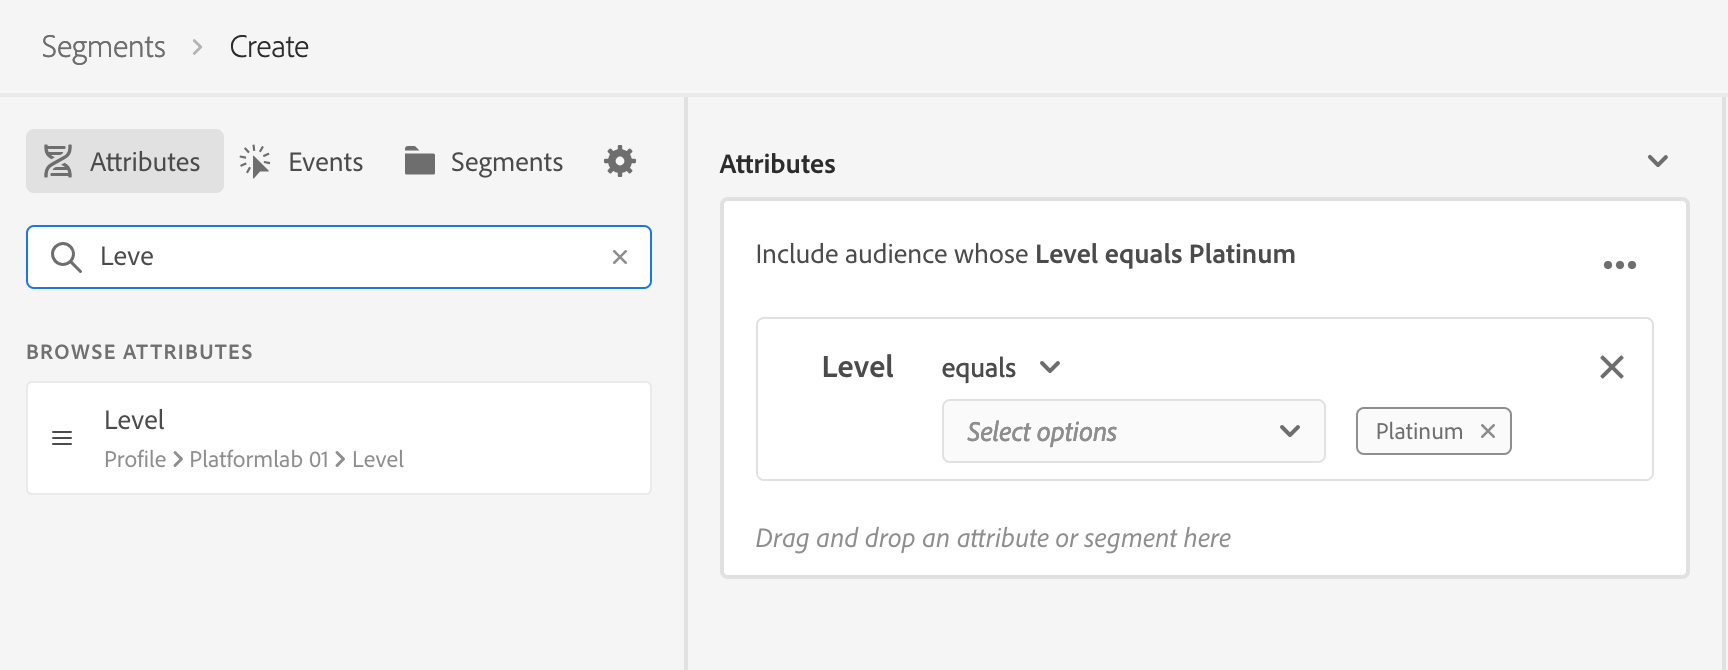
Drag the Level attribute to the right section of the screen and select Platinum from the drop down. Top section of the screen shows how many users will qualify for this segment. This calculation is done in real time.
Next search for state attribute. Drag the "state or province" attribute to the right. In the state type "OR"
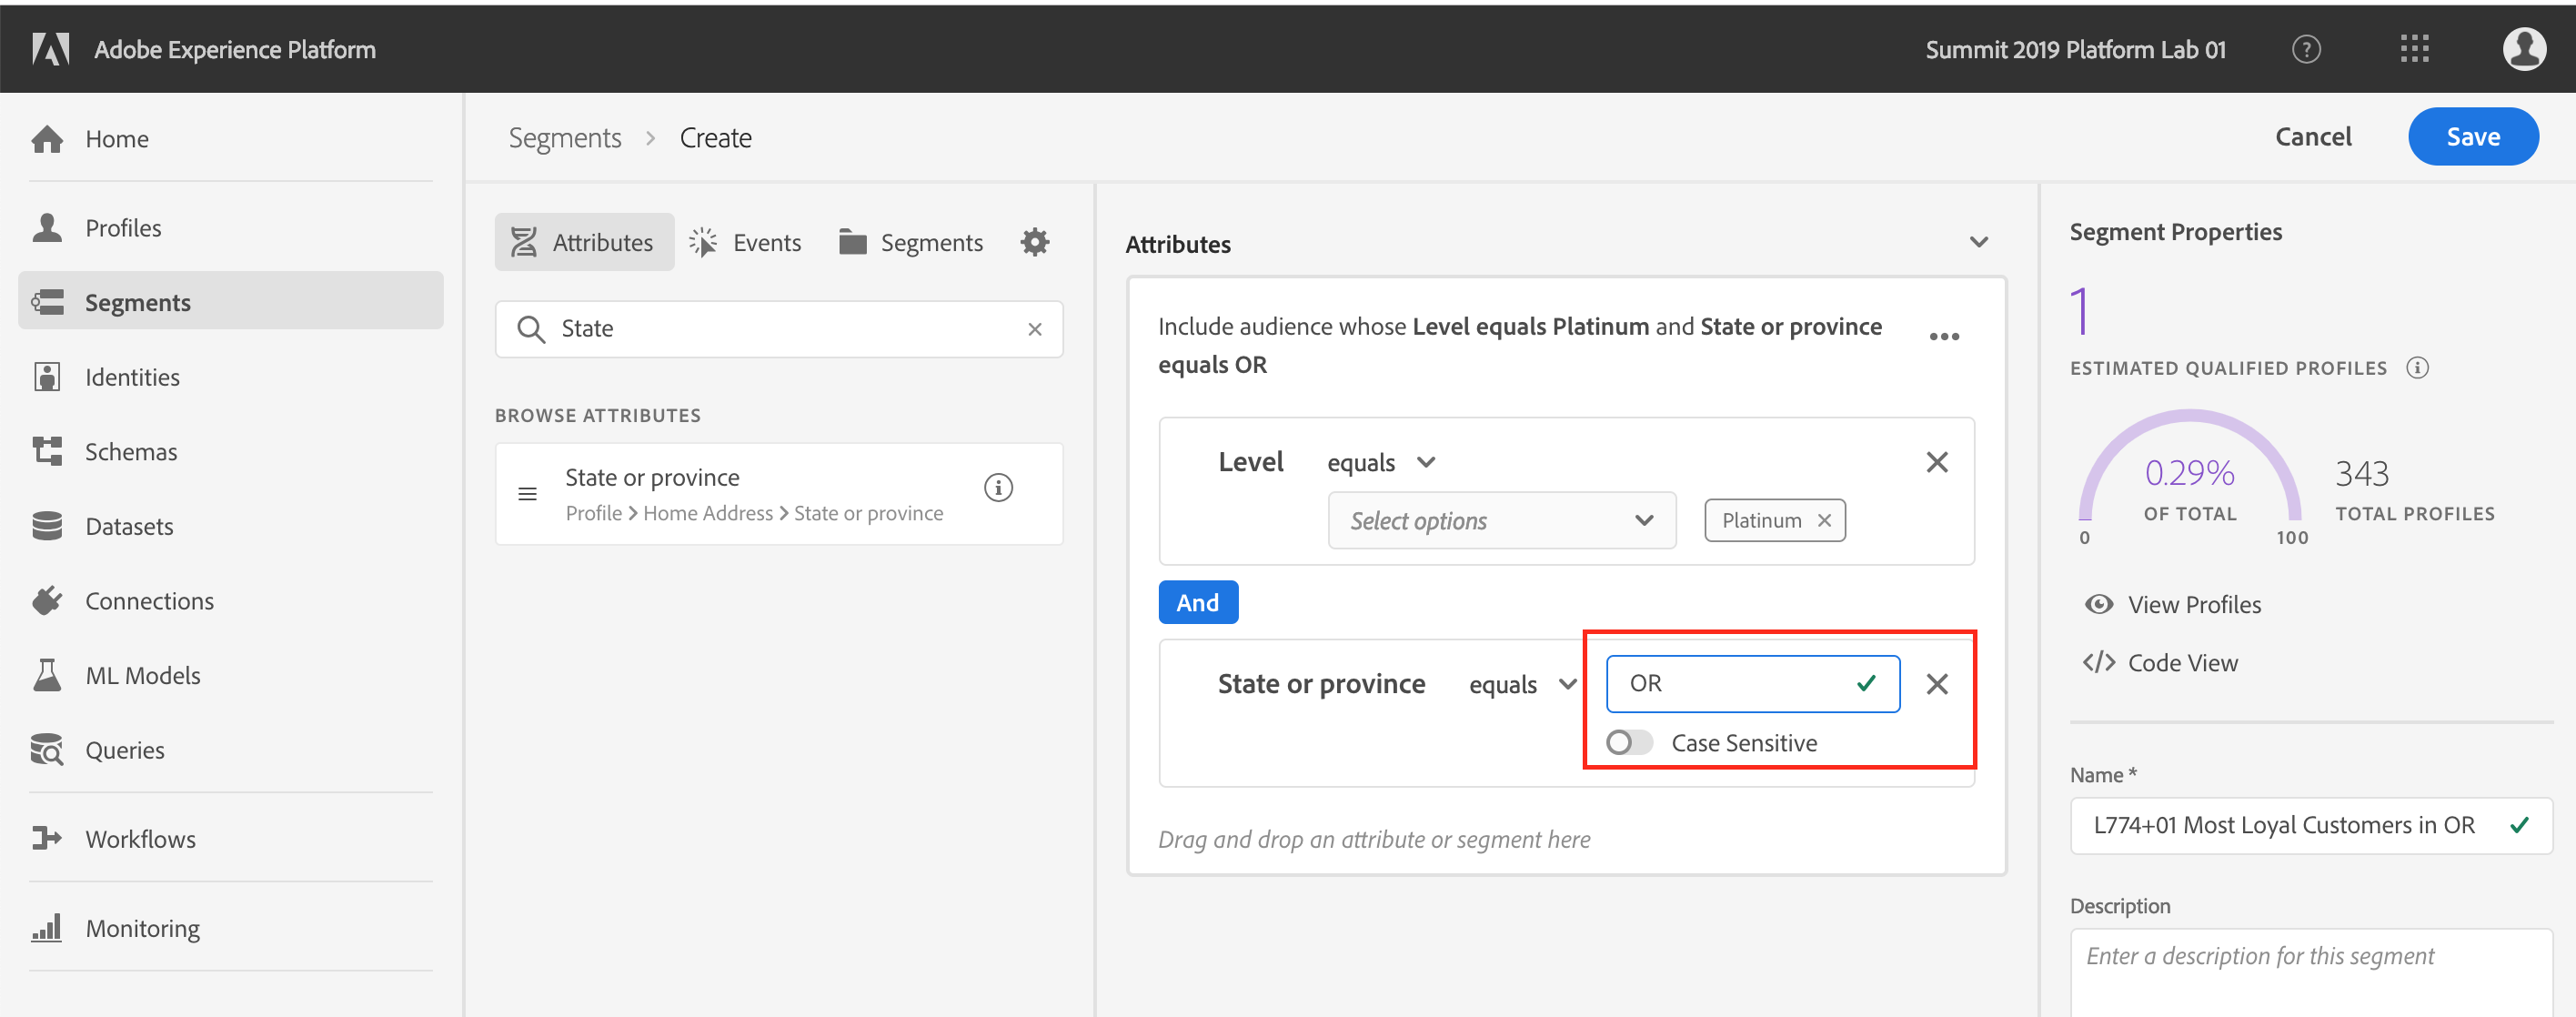
Save the segment. Now this segment can be used to send audiences for activation via any Adobe Solution.
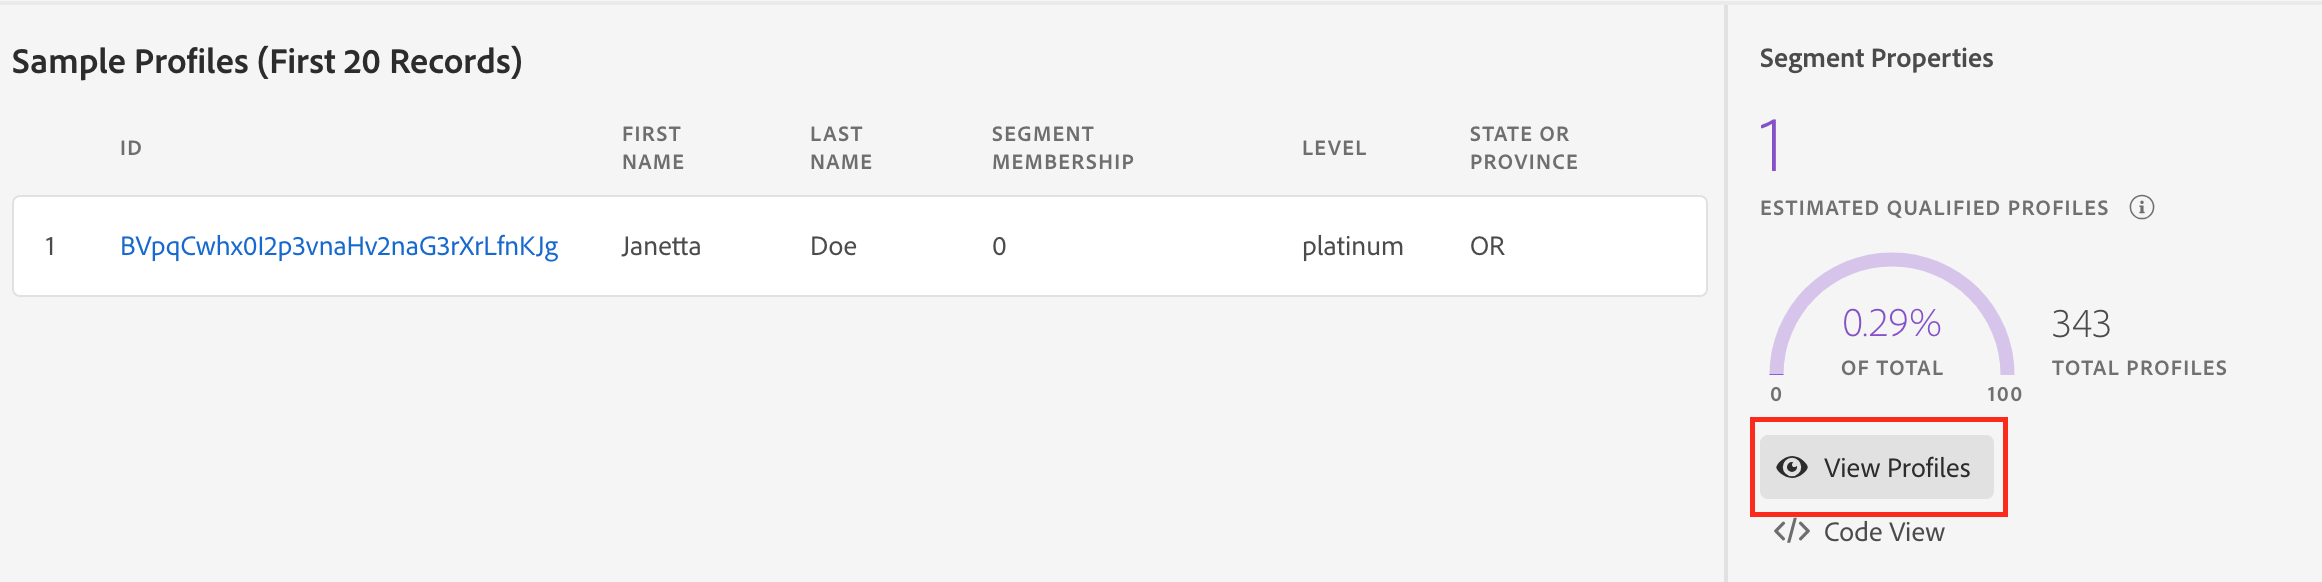
Click on "View Profile" to see a list of sample profile that belong to this segment.
Use Adobe Experience Query Service for omni-channel insights and attribution
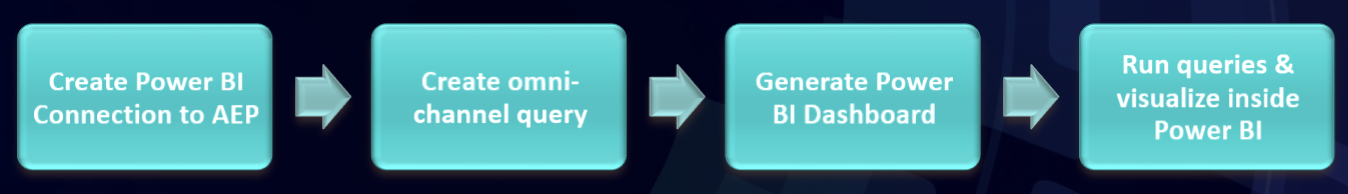
The Adobe Experience Query Service (Query Service) is a powerful analysis tool for discovering and directly querying all data in Experience Platform. The combination of Experience Data Model, all Adobe data in a single data lake, and the Query Service enables customers to analyze customer data in real-time for driving real-time customer journeys.
Query Service allows you to tap into all your data in Experience Platform using standard ANSI SQL. Query Service uses a PostgreSQL client as interface enabling a data analyst or an engineer to use various command tools and utilities that support the PostgreSQL driver lowering the bar for adoption. This makes it easy for anyone with SQL skills to quickly analyze large-scale dataset.
Since Query Service supports standard SQL it is easy to visualize the results of the Query inside Power BI. Query Service also has a purpose-built Power BI Connector for supporting interactive reporting & visualization within Power BI.
In this lab we are going to leverage Query Service to build visualizations in Power BI.
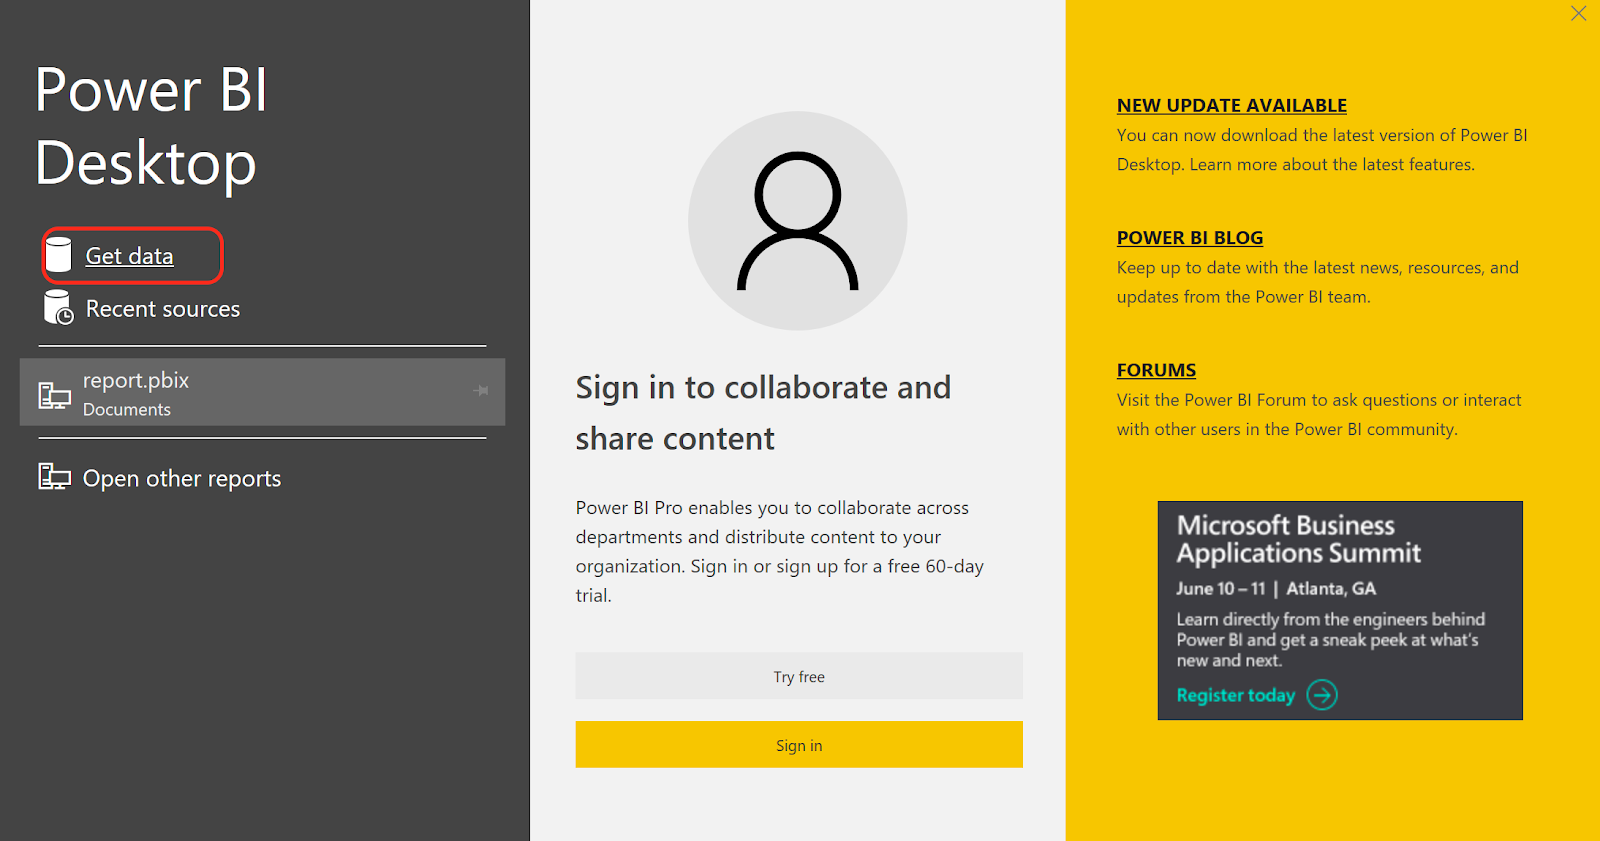
Launch Power BI from Windows Start Menu
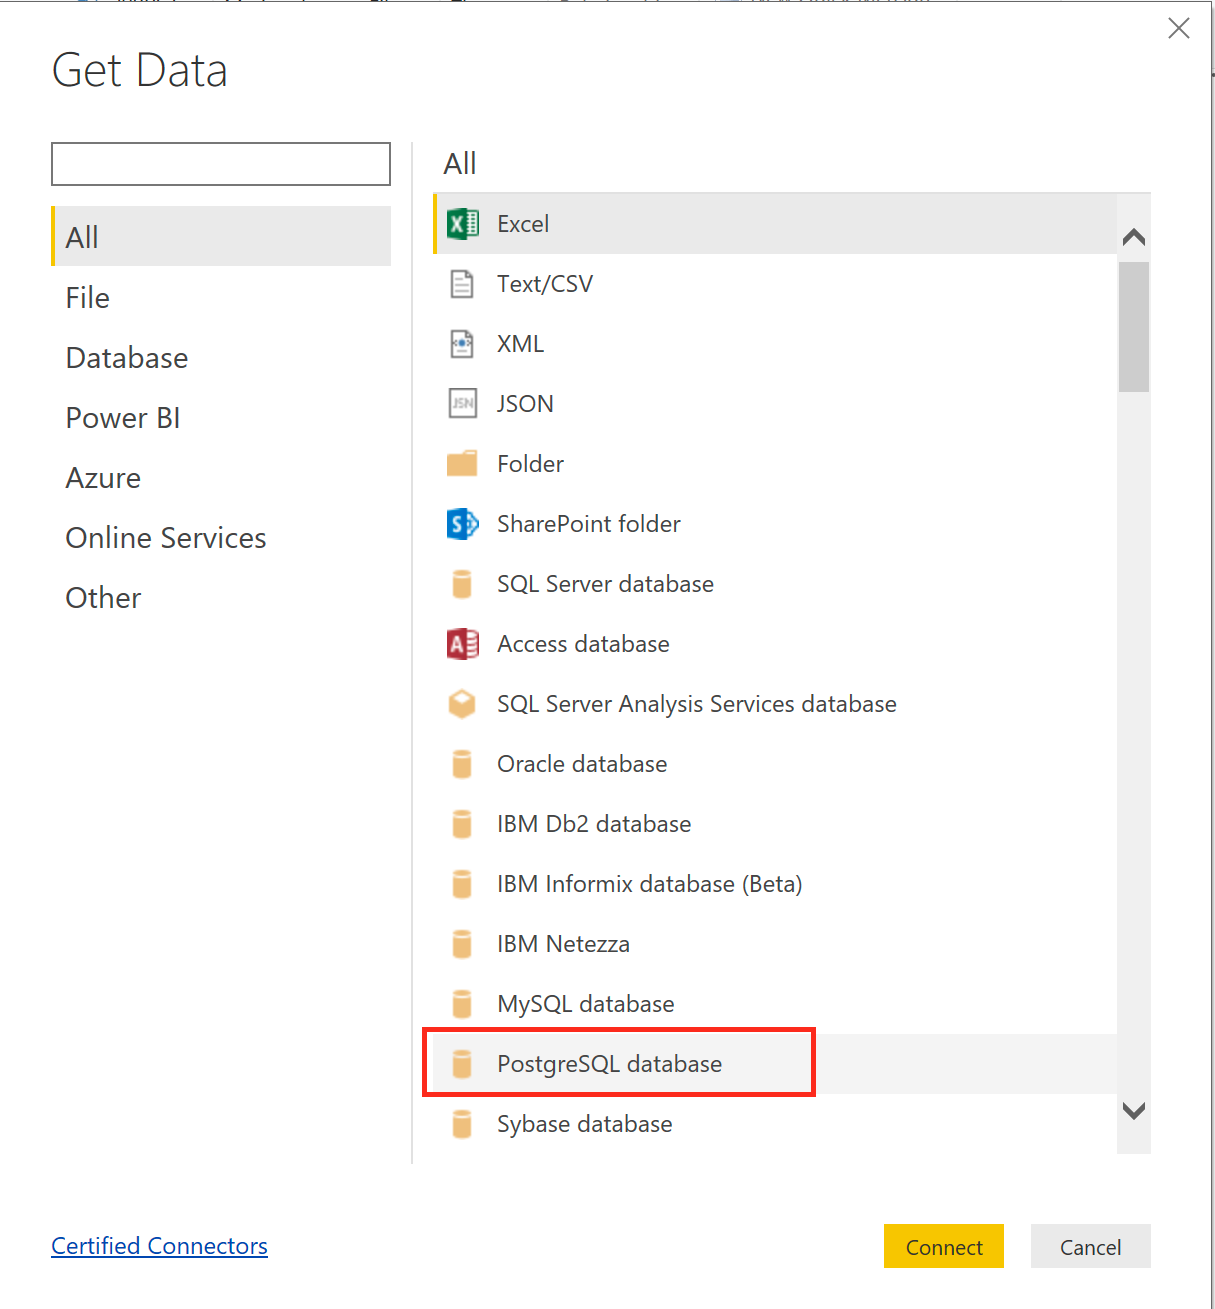
In Power BI, click on Get Data and select Postgrese SQL. Click Connect.
To connect to Experience Platform, we need to know the details about the Server, user ID, credentials. All these are made available in our UI in the following page: https://platform.adobe.com/query/bitools
Use the following SQL statement in the PostgreSQL database connection page
SELECT timestamp, hour(timestamp) as Hour, commerce.purchases.value as purchaseValue, commerce.checkouts.value as checkoutValue,
placeContext.geo._schema.latitude,
placeContext.geo._schema.longitude,
placeContext.geo.city,
placeContext.geo.countryCode,
placeContext.geo.stateProvince,
web.webpagedetails.name,
web.webpagedetails.pageviews.value as pageViews,
enduserids._experience.aaid.id,
_experience.analytics.session.num AS sessionNum
FROM x2019_summit_platform_lab_1_postvalues_1;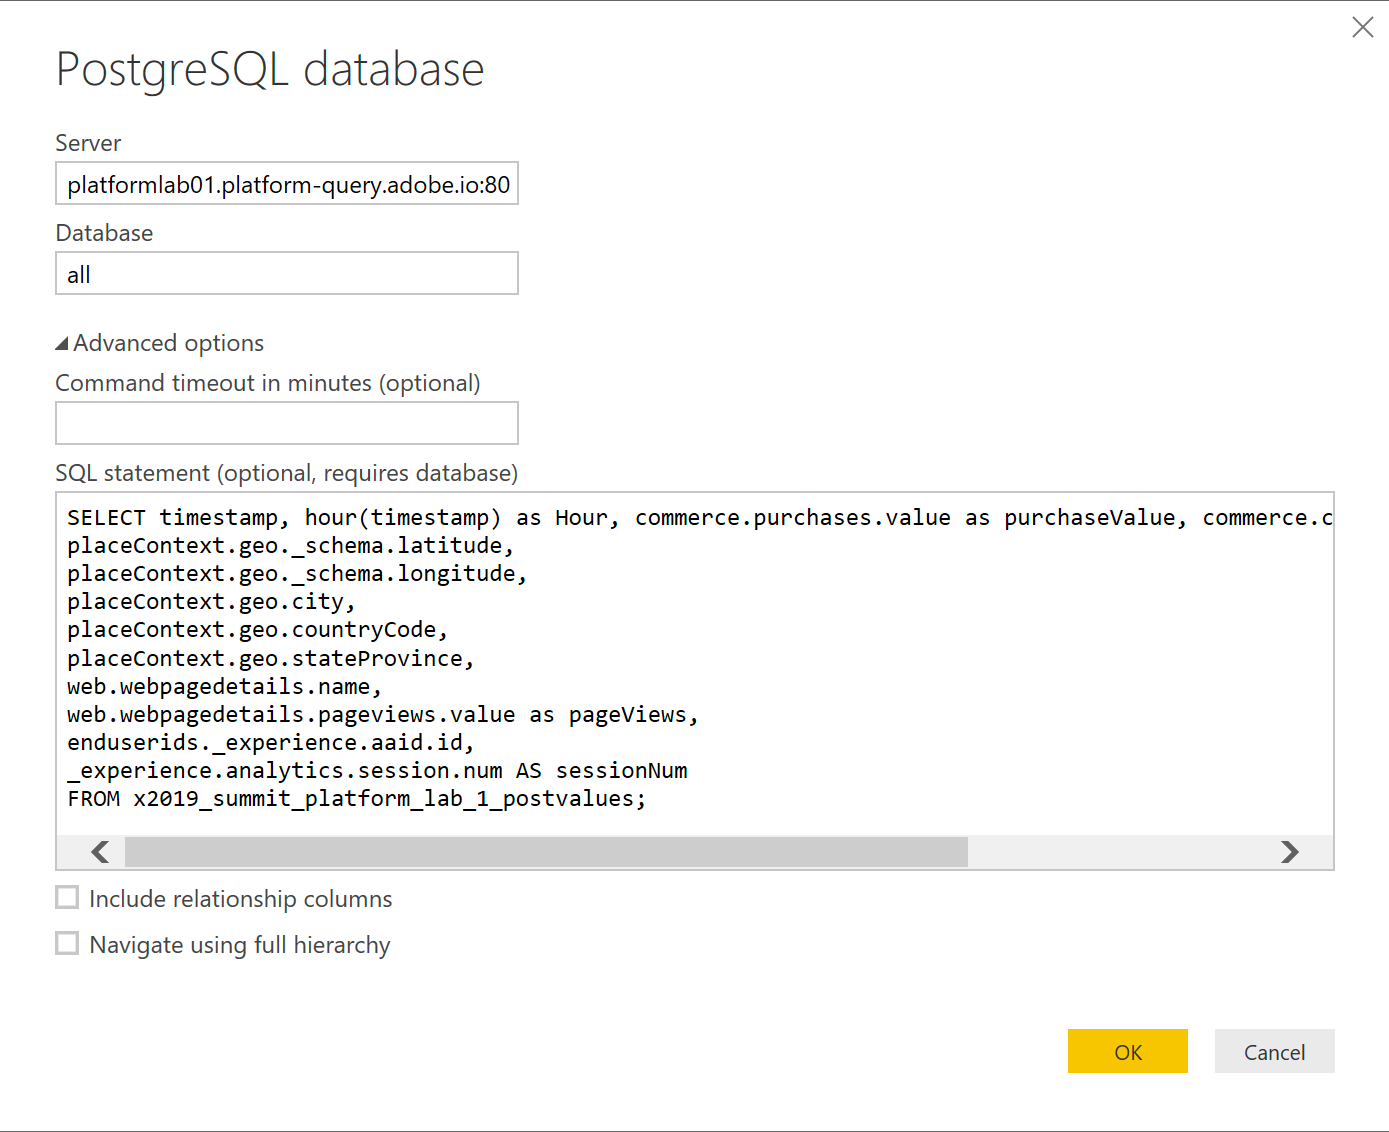
Uncheck the “Include relationship columns” checkbox and click OK.
We now need to provide Credentials for Experience Platform. These credentials can be found in the same UI: https://platform.adobe.com/query/bitools
Click “Connect”
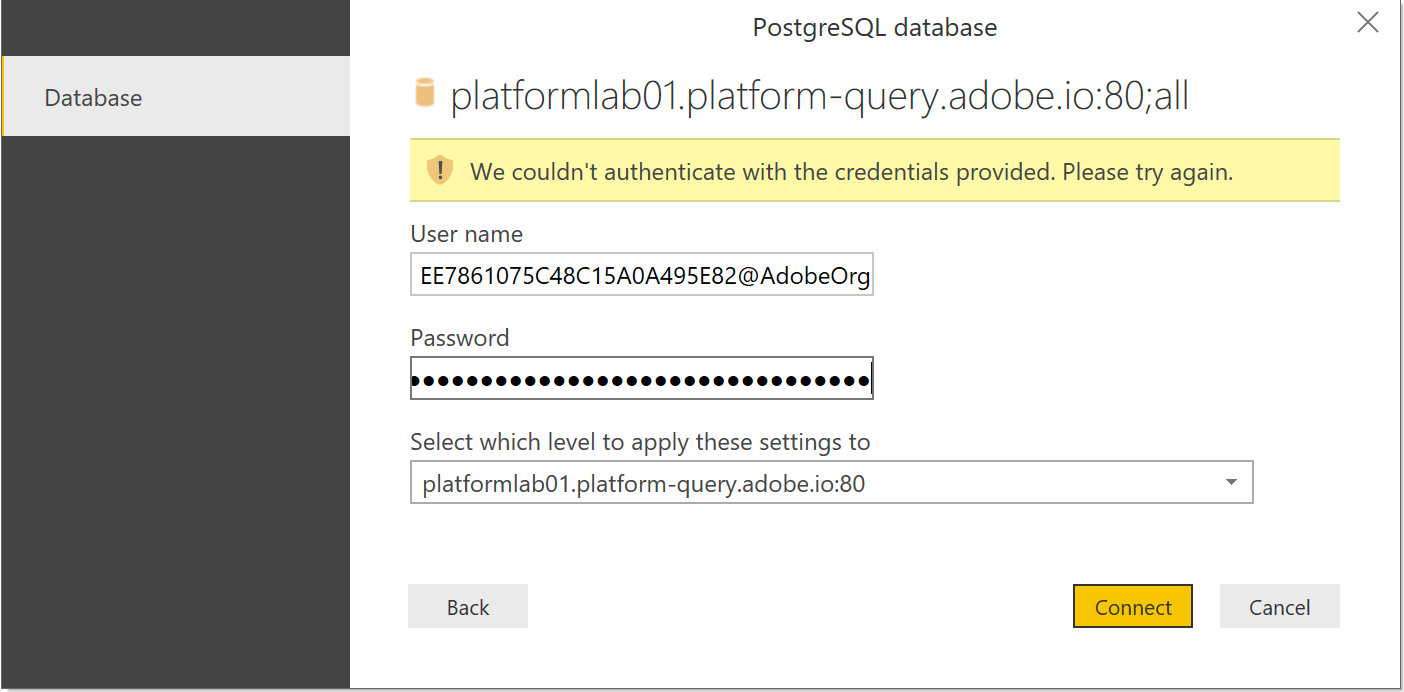
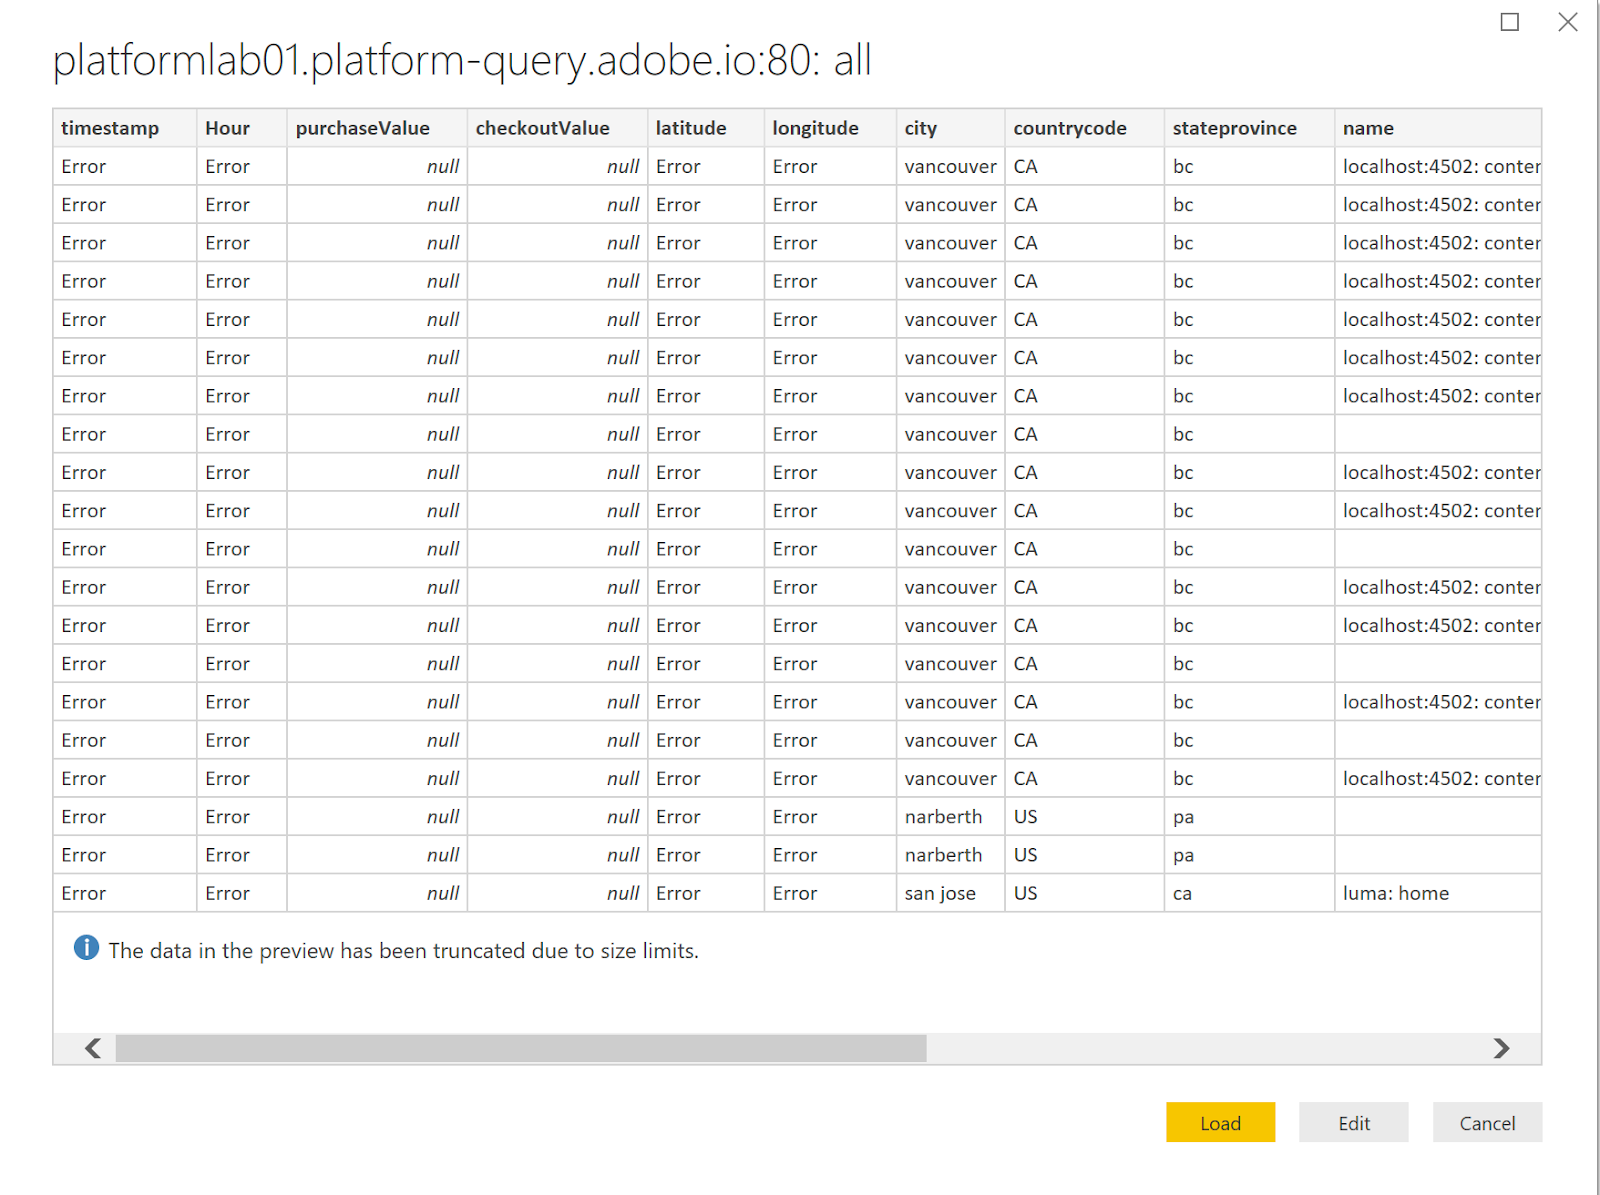
You will see a preview of data. It should look like the following. Click Load to continue.
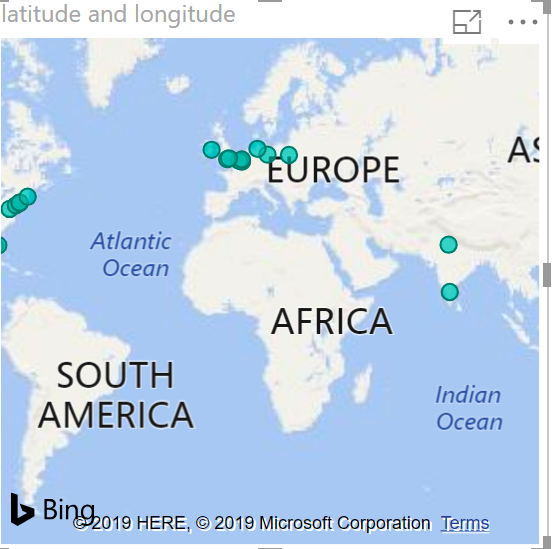
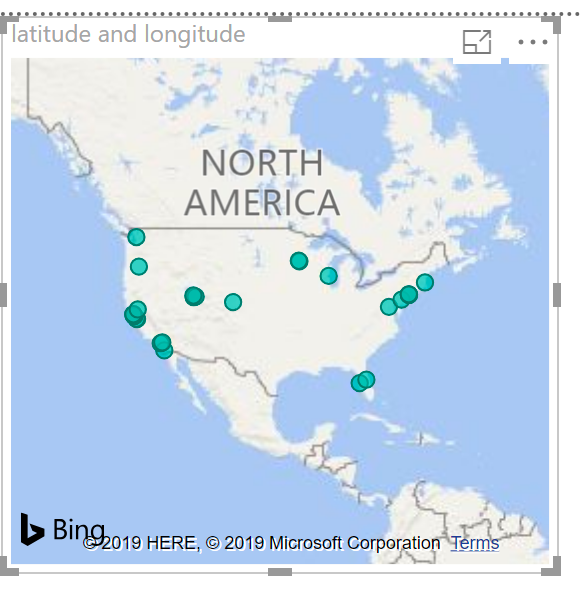
To build this visualization we are going to leverage the location information captured in ExperienceEvents data. In the query used for this exercise we included Latitude and Longitude in the query, so these fields are available to us in Power BI.
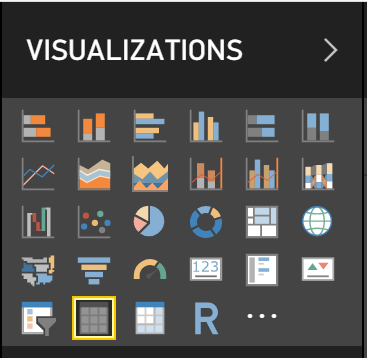
Select “Map” Visualization from the right hand panel
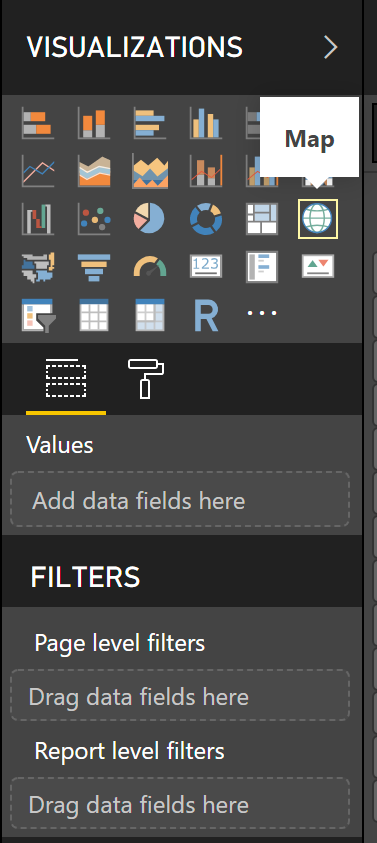
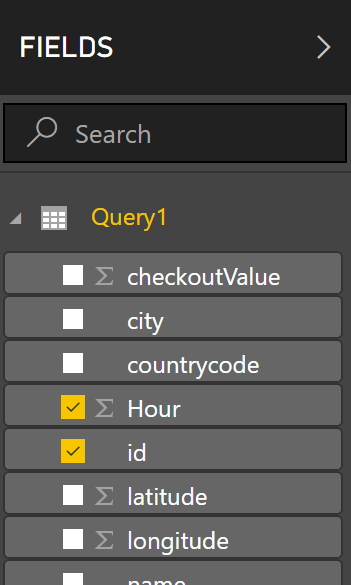
Select latitude and longitude fields
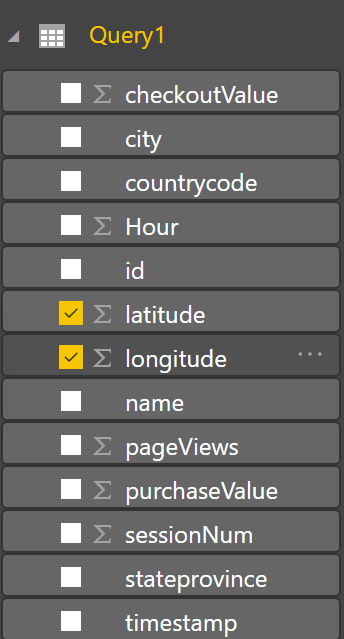
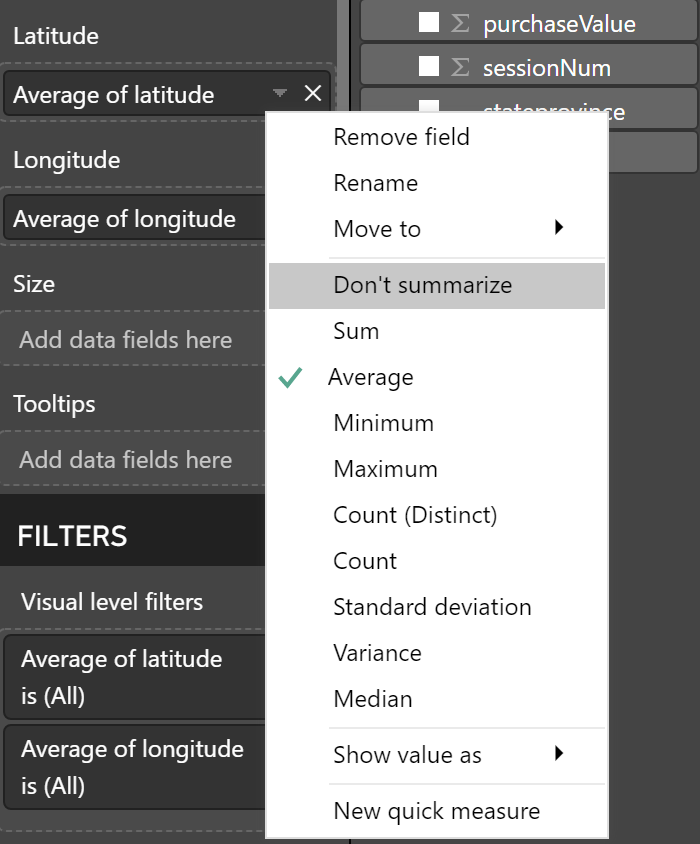
By default Power BI summarizes the latitude and longitude values, however we need individual values to show them on a map. We can fix this by right clicking on the appropriate fields and selecting “Don’t summarize” option. Do this for both latitude and longitude.
At this point we should see a world map with different locations highlighted. Next lets filter only the customers in United States.
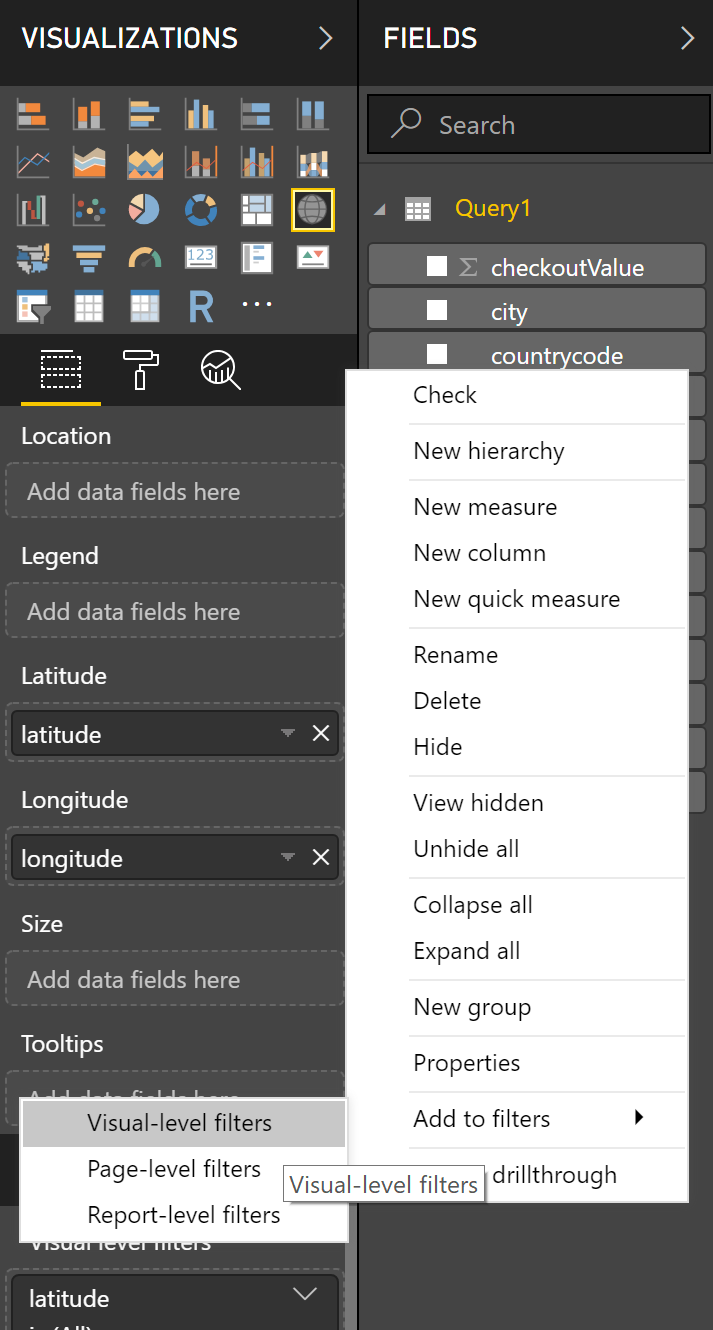
Add a filter for country. Right click on the countrycode field and select “Add to filters” -> “Visual-level filters”
Under the filters section search for US and select “US”
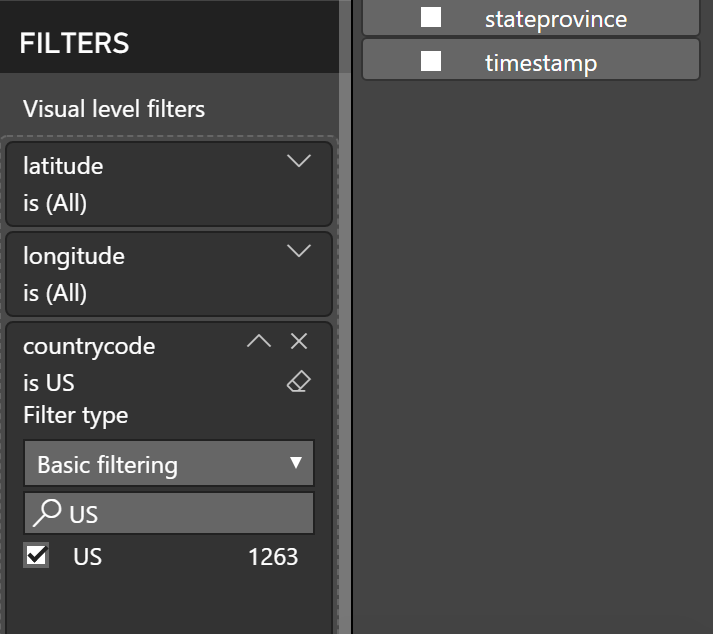
Now you should see a map with only locations in United States
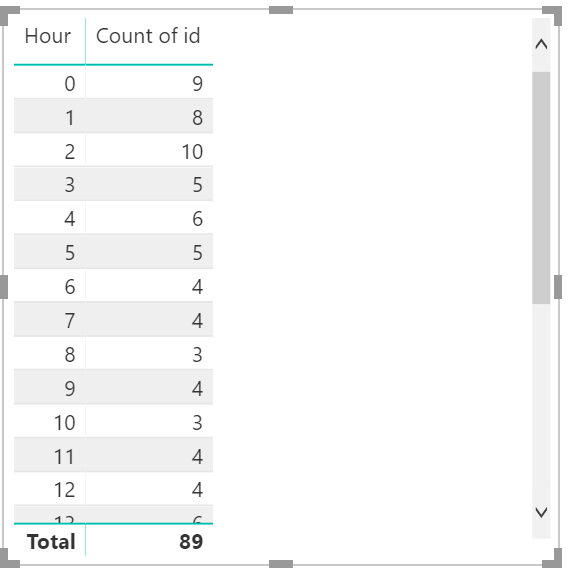
Now we will build a visualization to find numbers of unique visitors browsing Luma website each hour of the day. To do this, we will leverage different Experience Cloud IDs captured in ExperienceEvents.
Select Table from Visualizations
Select Hour and id fields
By default Power BI aggregates all the hours. Let's fix this.
Right click on the Hour under Values, and select Don’t summarize.
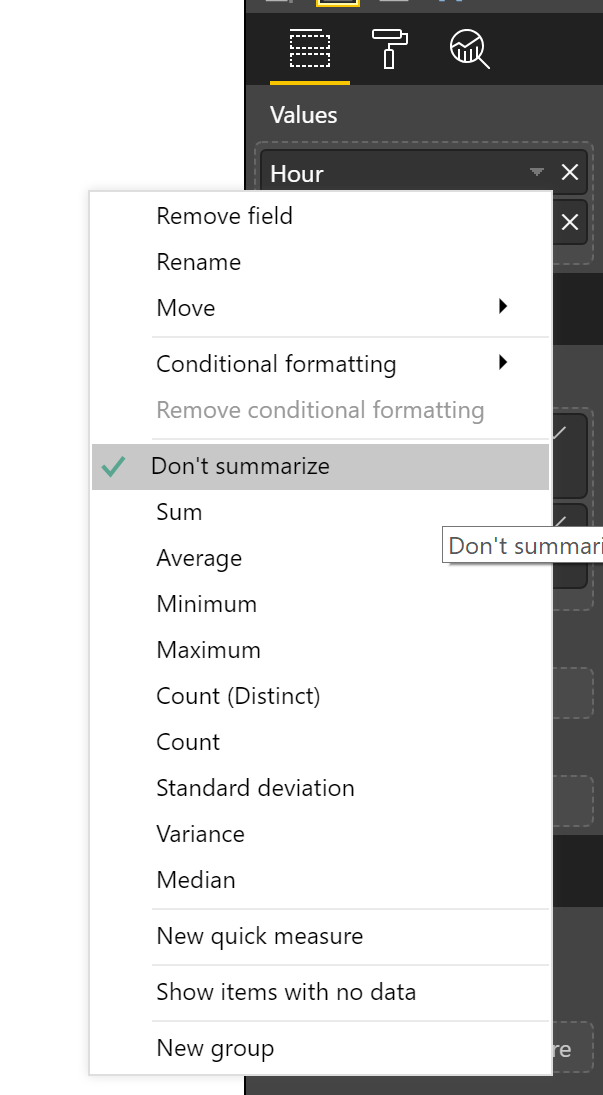
We need to count unique visitors, this can be done by applying Count(Distinct) function to id. Right click on id field and select Count(Distinct).
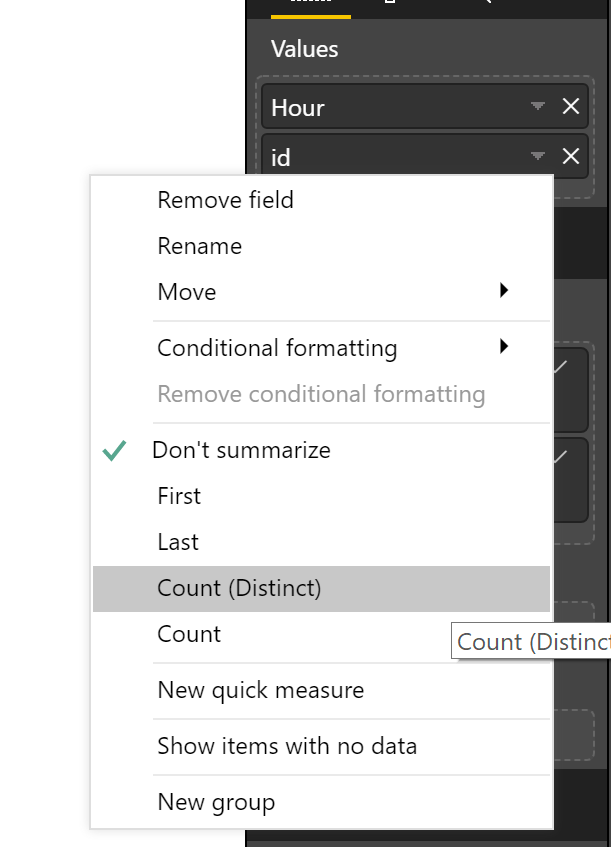
Now we have a list of unique visitors to Luma website for each hour of the day
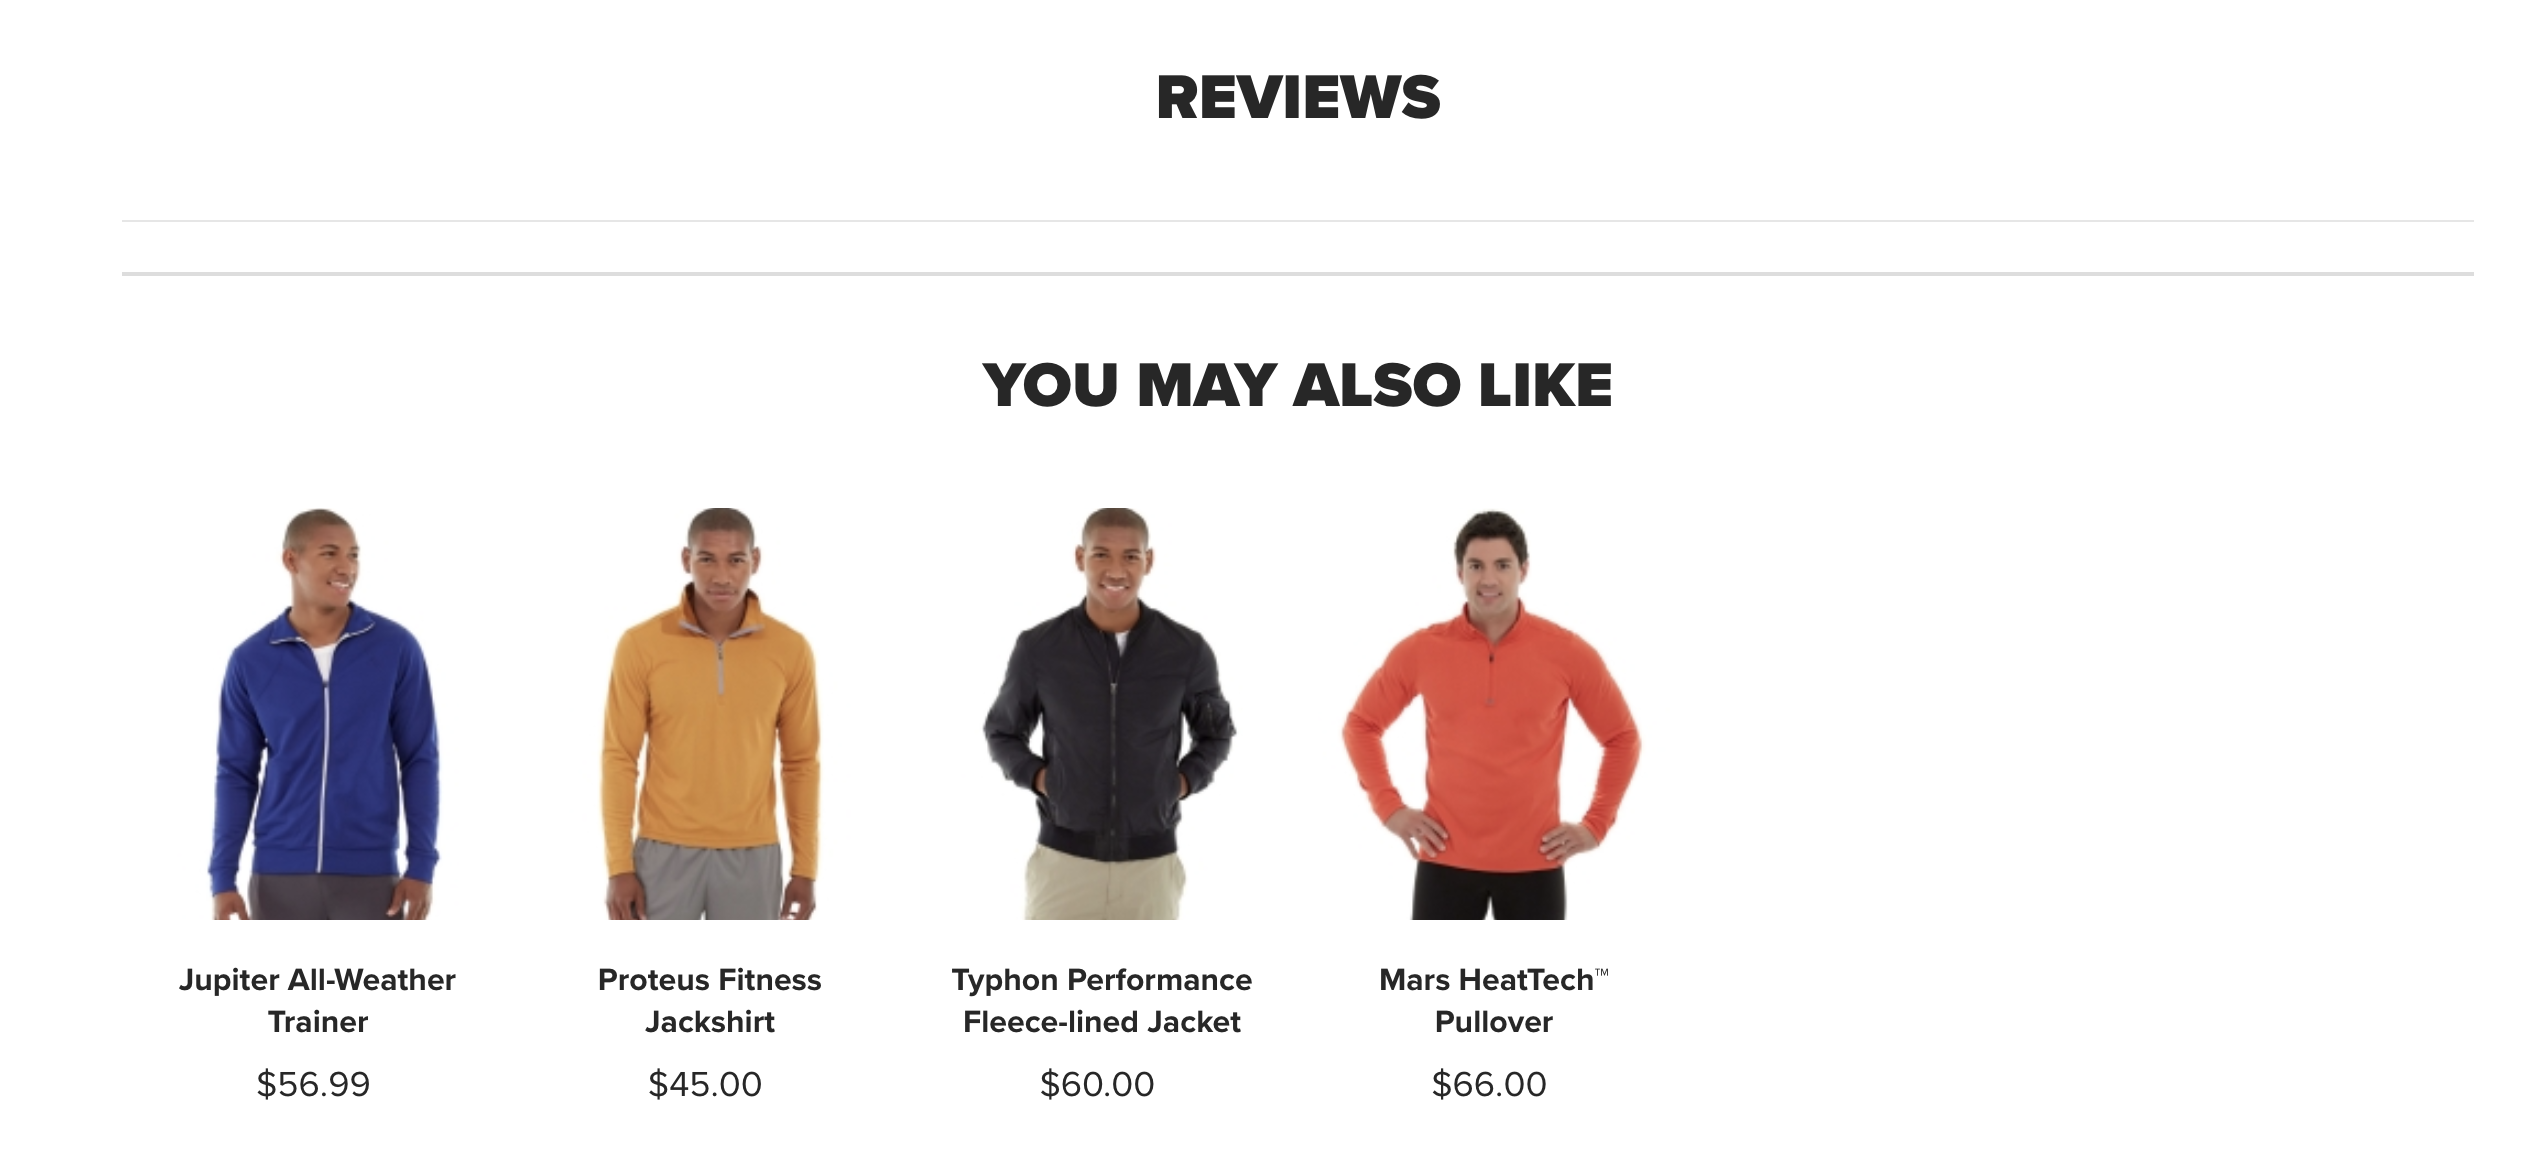
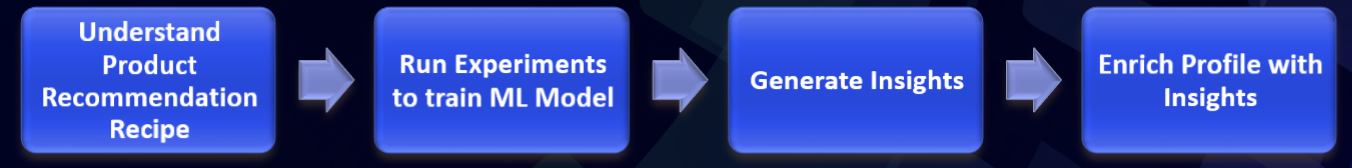
In the LUMA website, you'll notice that there are recommended products on each product page. The goal of this part of the lab is to show you how Experience Platform customers can generate product recommendations using a trained machine learning model using Data Science Workspace.
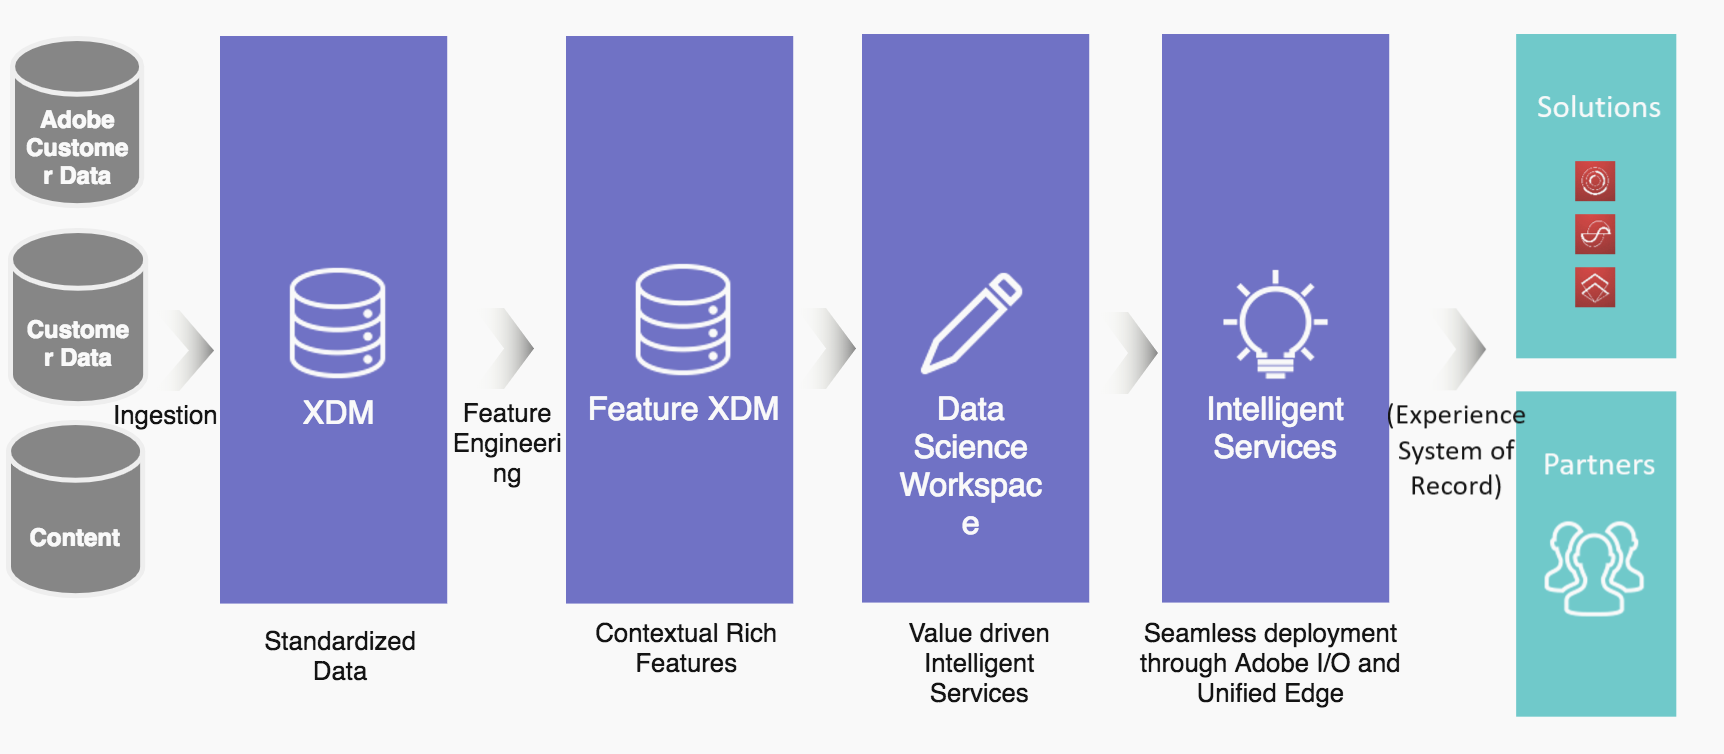
Experience Platform leverages domain expertise of Adobe products and partners to unleash insights from your data using machine learning and artificial intelligence. You can utilize pre-built machine learning models powered by Adobe Sensei, or author your own models to do data science on top of your content and data assets across Adobe solutions.
Adobe Experience Platform leverages domain expertise of Adobe products and partners to unleash insights from your data using machine learning and artificial intelligence. You can utilize pre-built machine learning models powered by Adobe Sensei, or author your own models to do data science on top of your content and data assets across Adobe solutions.
You can learn more about the data science capabilities of Experience Platform at: https://www.adobe.io/apis/experienceplatform/home/data-science-workspace/dsw-overview.html
In this lesson, we will use Experience Platform to predict customer purchase behavior. We will do this by applying a customized random forest classifier and a two-tiered experience data model to predict the probability of a purchase event. The model utilizes input data incorporating customer profile information and past purchase history and defaults to pre-determined configuration parameters determined by our data scientists to enhance predictive accuracy.
Recipes enable you to generate insights from data on Experience Platform. A recipe is a proprietary machine learning or AI algorithm, or an ensemble of machine learning or AI algorithms, to help solve specific business problems.
Navigate to Experience Platform: https://platform.adobe.com
Navigate to the ML Models tab on the left rail
In the Recipes sub-tab, you will find a pre-built Popularity Based Recommendation Recipe. For this lab, we will be using this recipe.
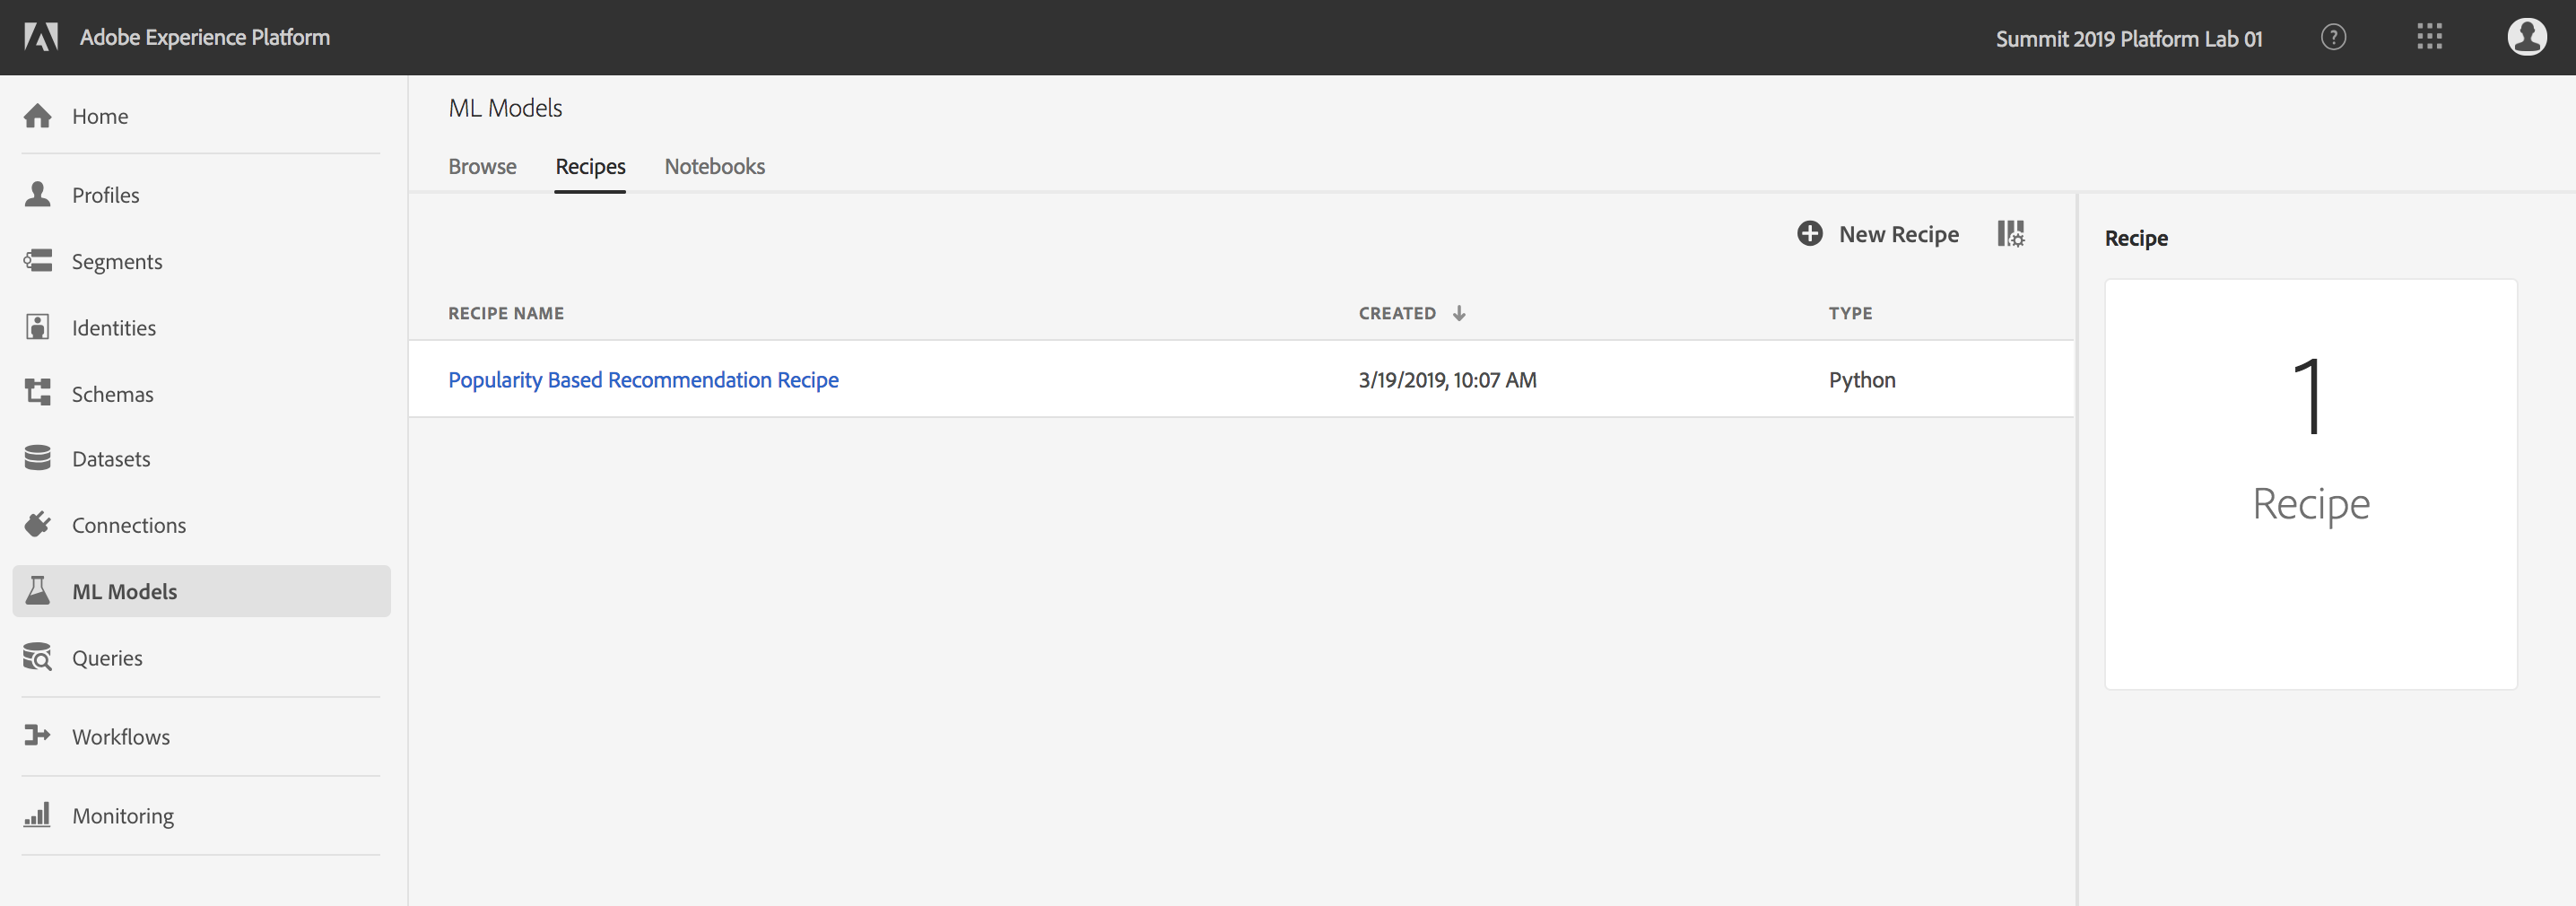
Popularity Based Recommendationn is a pre-built recipe powered by Adobe Sensei and is shipped with Experience Platform. Besides, you can utilize powerful model authoring capabilities to create your own recipes using JupyterLab integrated into Experience Platform.
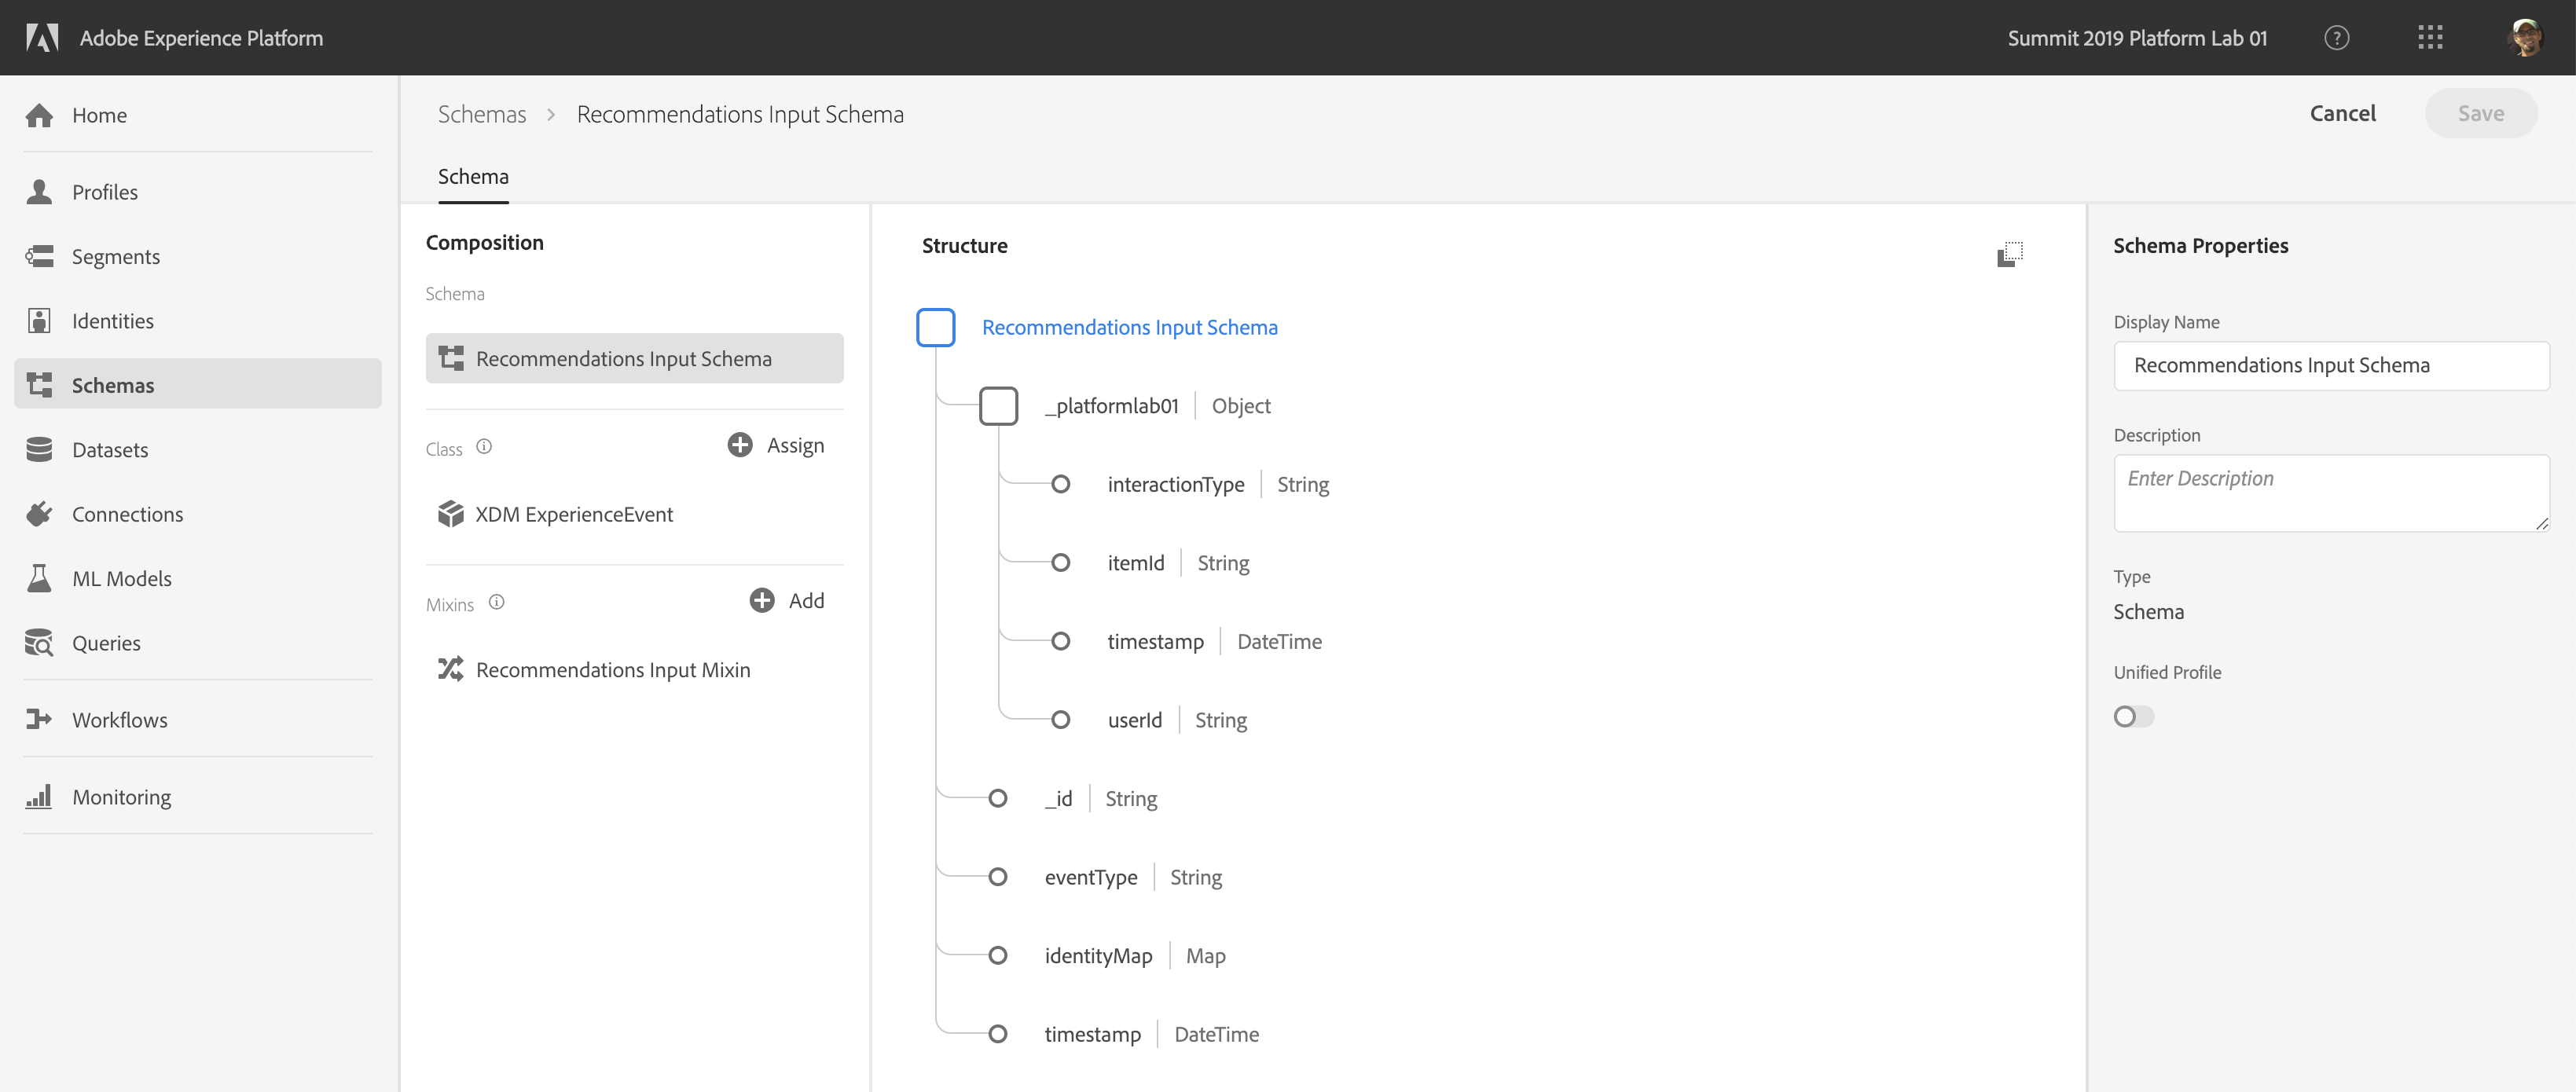
In order to create a trained ML model and generate recommendations, Popularity Based Recommendation Recipe requires the following features as input for training: User ID, Product ID, Type of interaction that user had with product, Timestamp of interaction.
For this lab, we will use the Recommendations Input Dataset as input data. This dataset is based on the Recommendations Input Schema. It has been pre-created by feature engineering Luma Global - postValues dataset ingested from Adobe Analytics, to extract the columns required for the recipe:
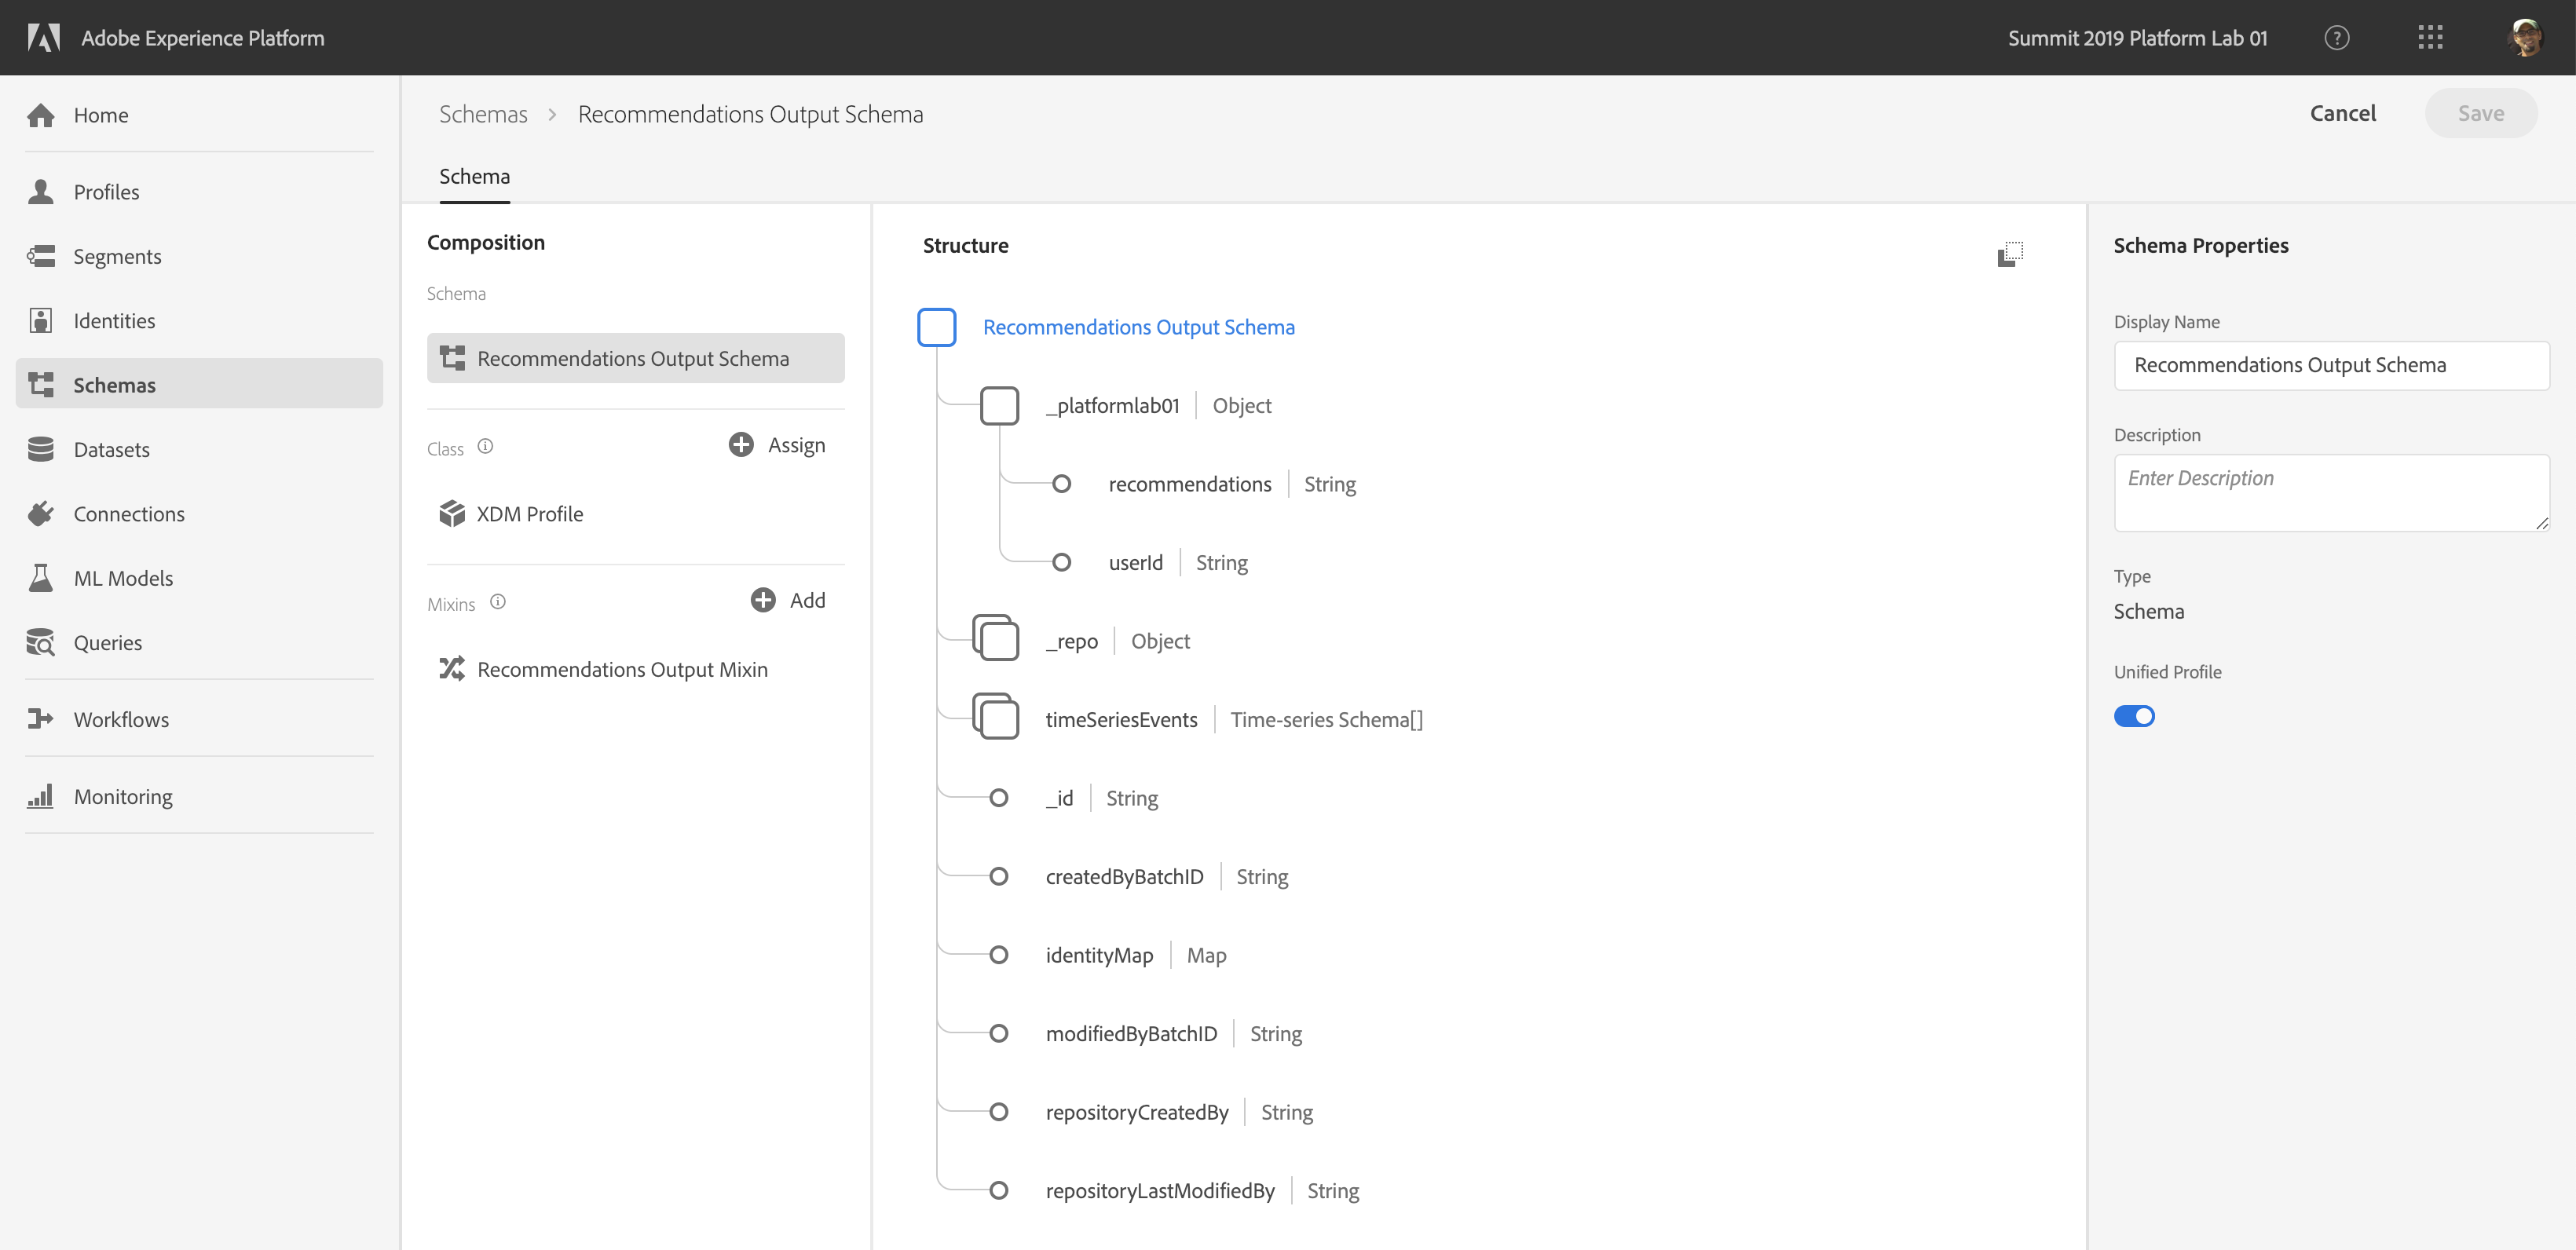
The trained model can take the above input features and create scoring output in the following format: User ID, List of recommended product IDs.
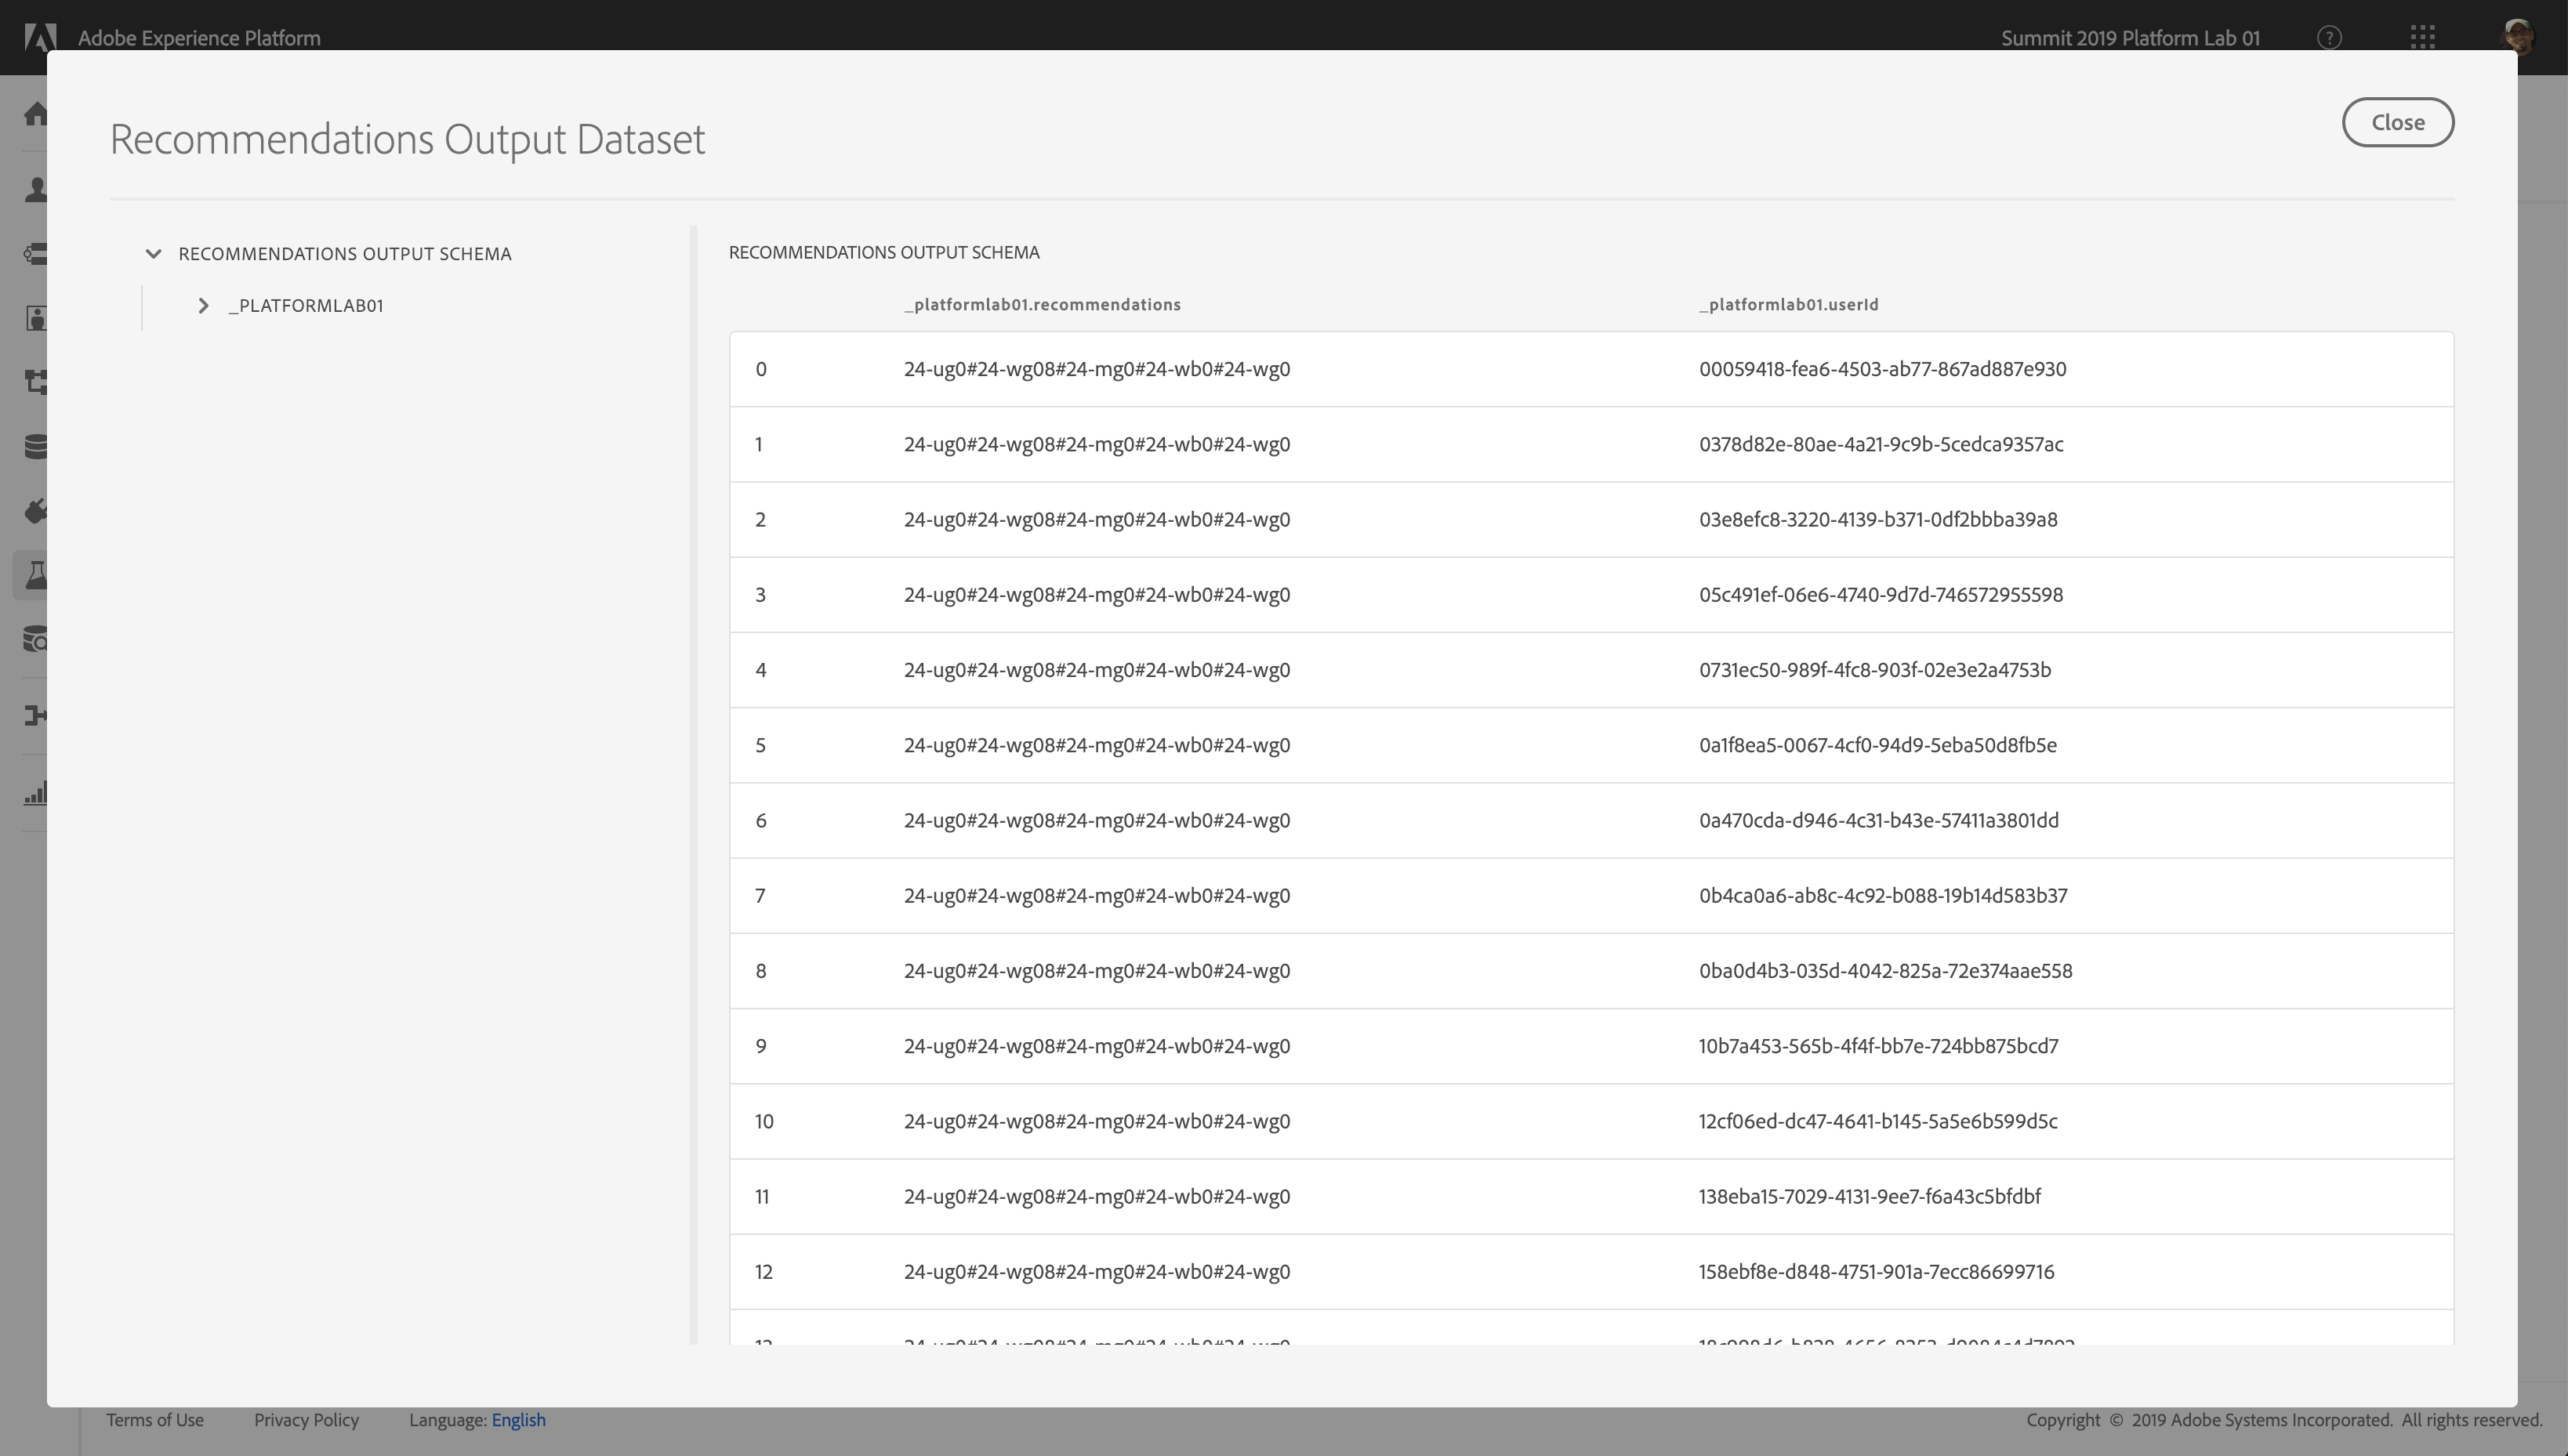
For this lab, we will use the Recommendations Output Dataset to hold the output data. This dataset has already been created for your and is based on the Recommendations Output Schema. Both dataset and schema have been pre-created for you and are ready for you to use. Use this time to familiarize yourself with the output schema, look specifically for these fields:
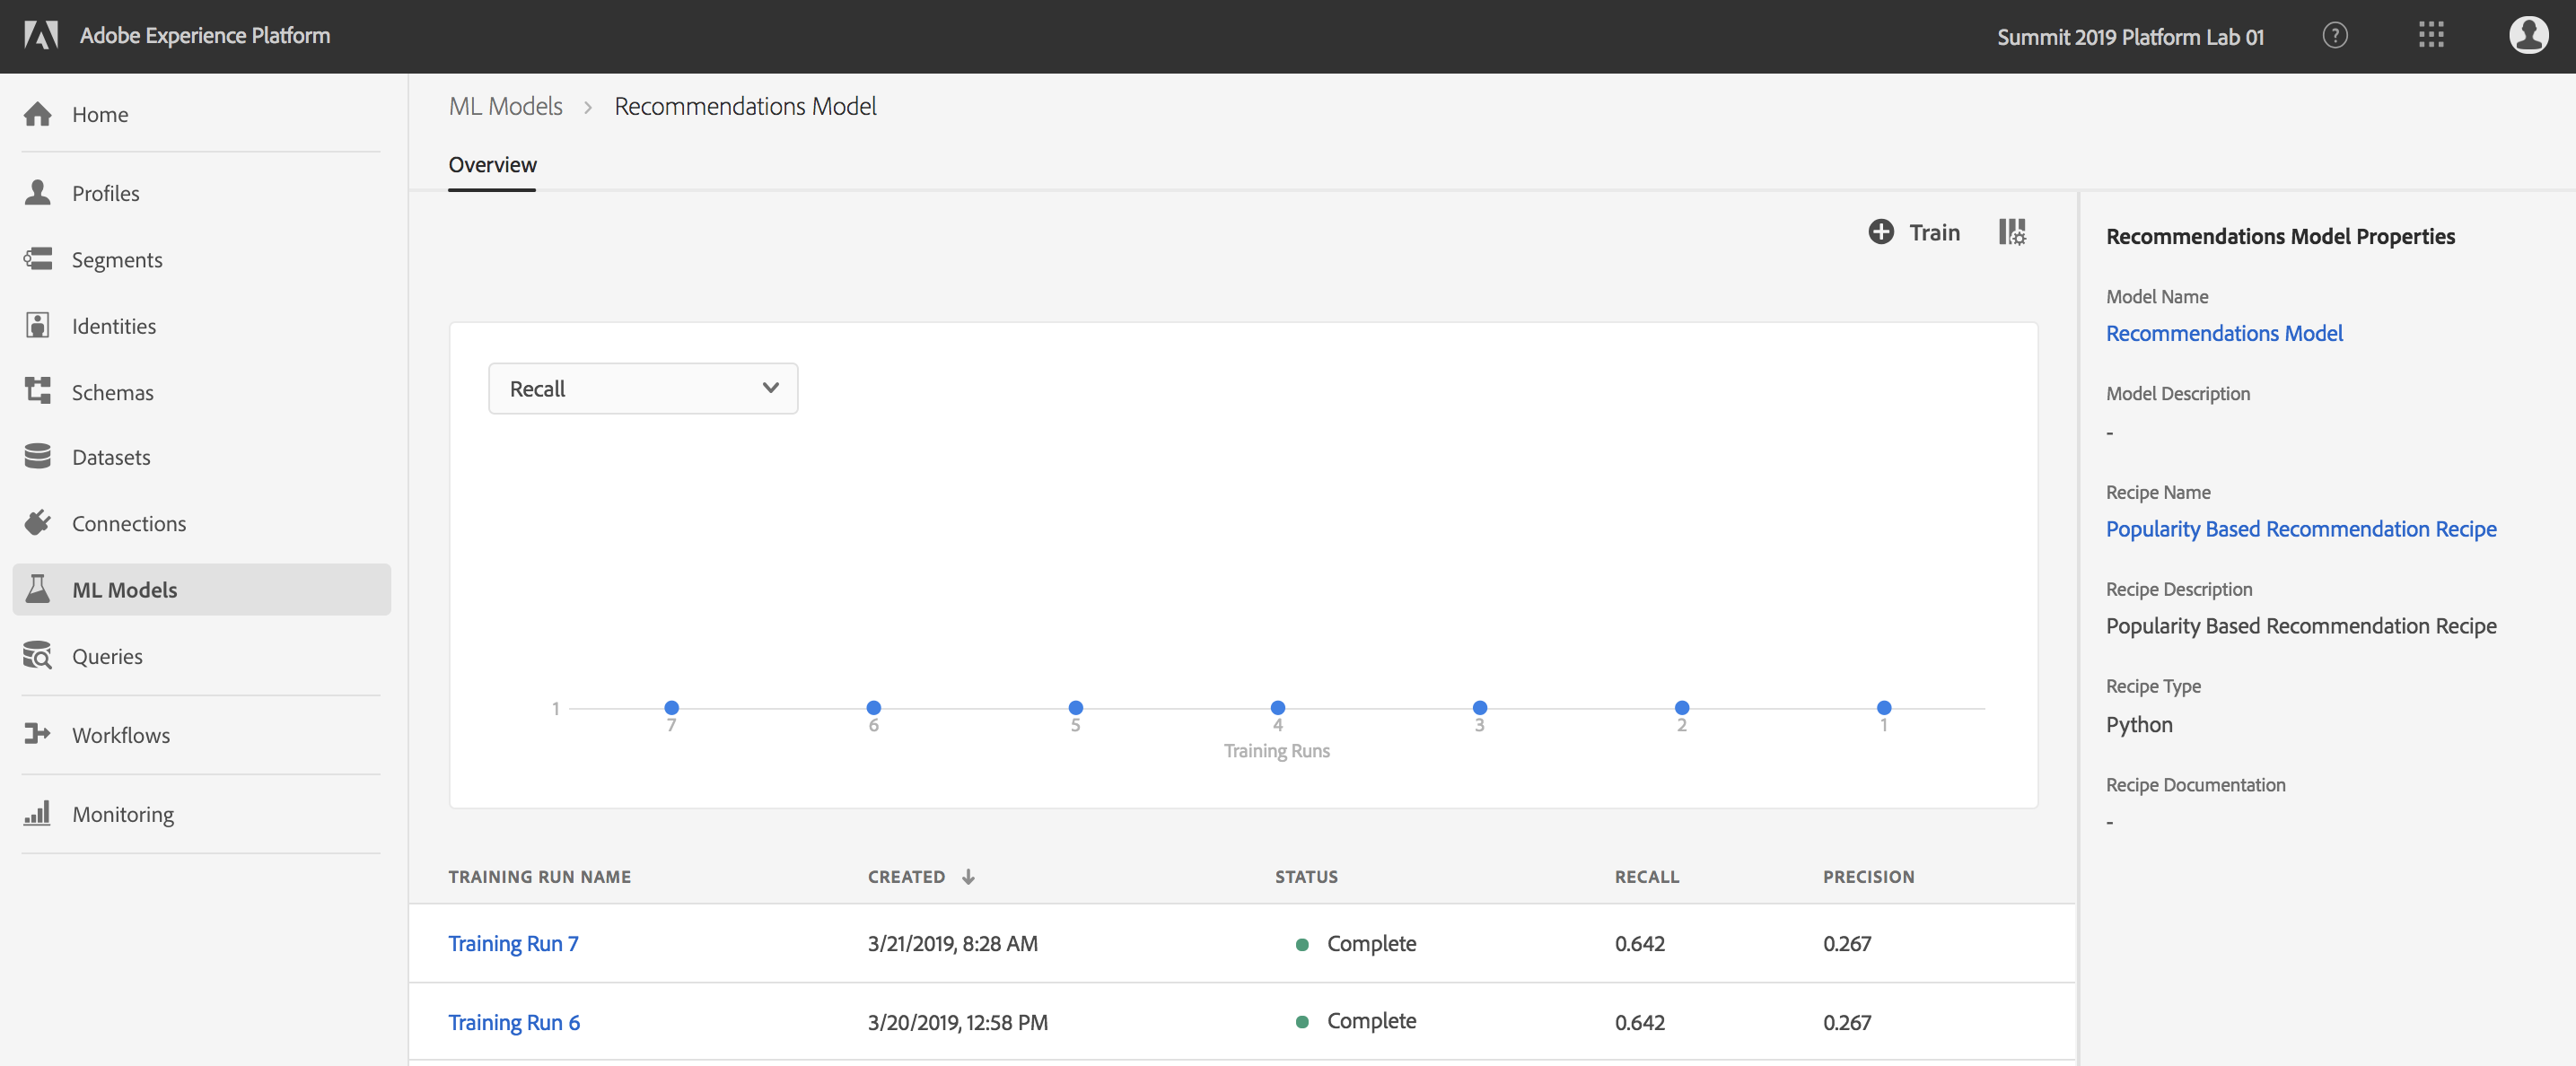
While in the ML Model tab, select the Recipes sub-tab, and select the Popularity Based Recommendation Recipe. You will find a pre-created model for this recipe: Recommendations Model. For this lab we will be using this model.
Open the pre-created model and review the details.
On the model details page, you can view any pre-existing training runs. This screen provides you with the opportunity to train the model against input data.
On the Model page click on the button called Train on the top right corner of the screen.
Notice that on the Training Input page you're shown only those datasets which match the schema configured in the recipe. Choose the Recommendations Input Dataset and click Next.
The configuration step allows you to configure this training run. For now we will leave the num_recommendtions parameter at the default value, but let's change sampling_fraction to 0.7 - double click on the existing 1.0 value to make that change. Adjusting these hyperparameters is a great way to experiment when running subsequent training tasks.
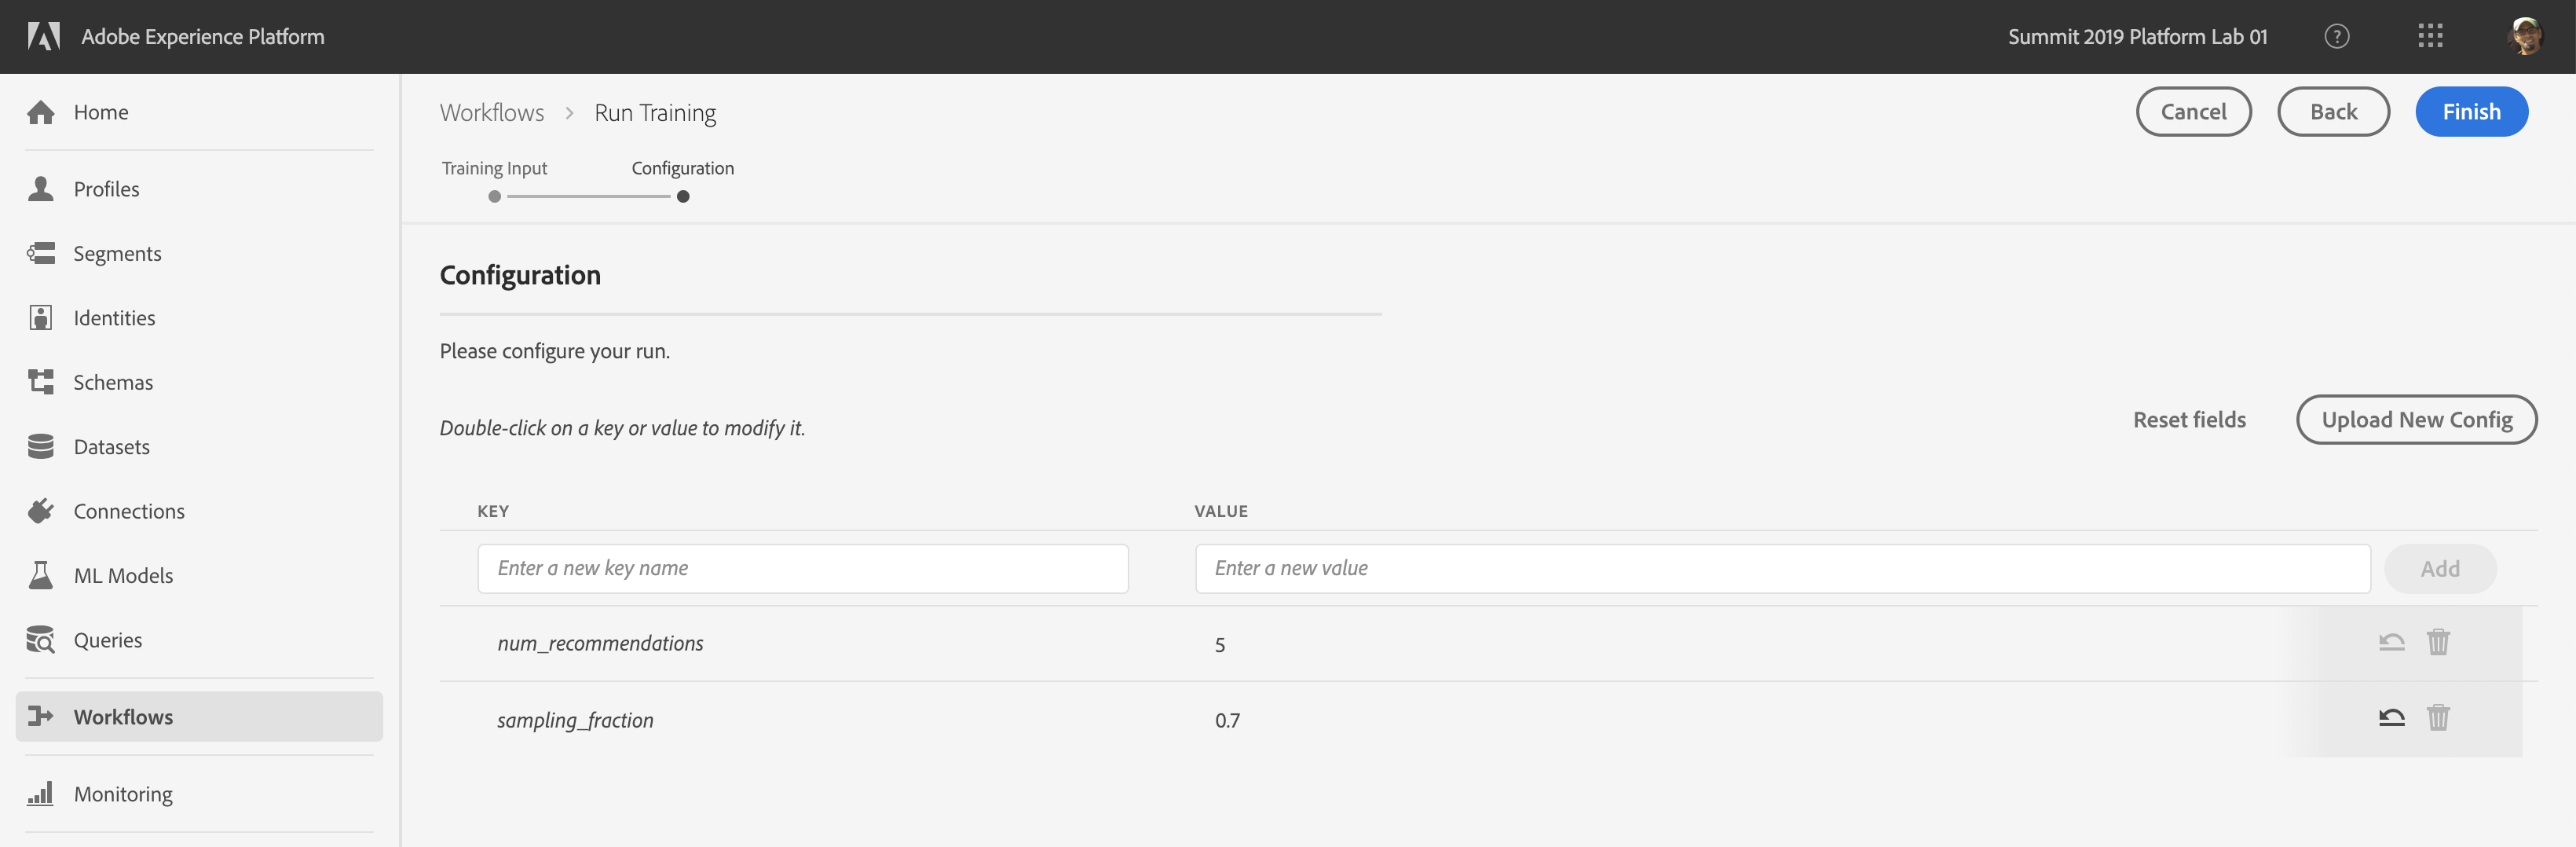
Hyperparameters cannot be learned, they must be assigned before training of the model. Adjusting the parameters may change the accuracy of the trained model.
Click Finish to start the training task.
Wait for the training task to complete (<1 min). Once complete click into it.
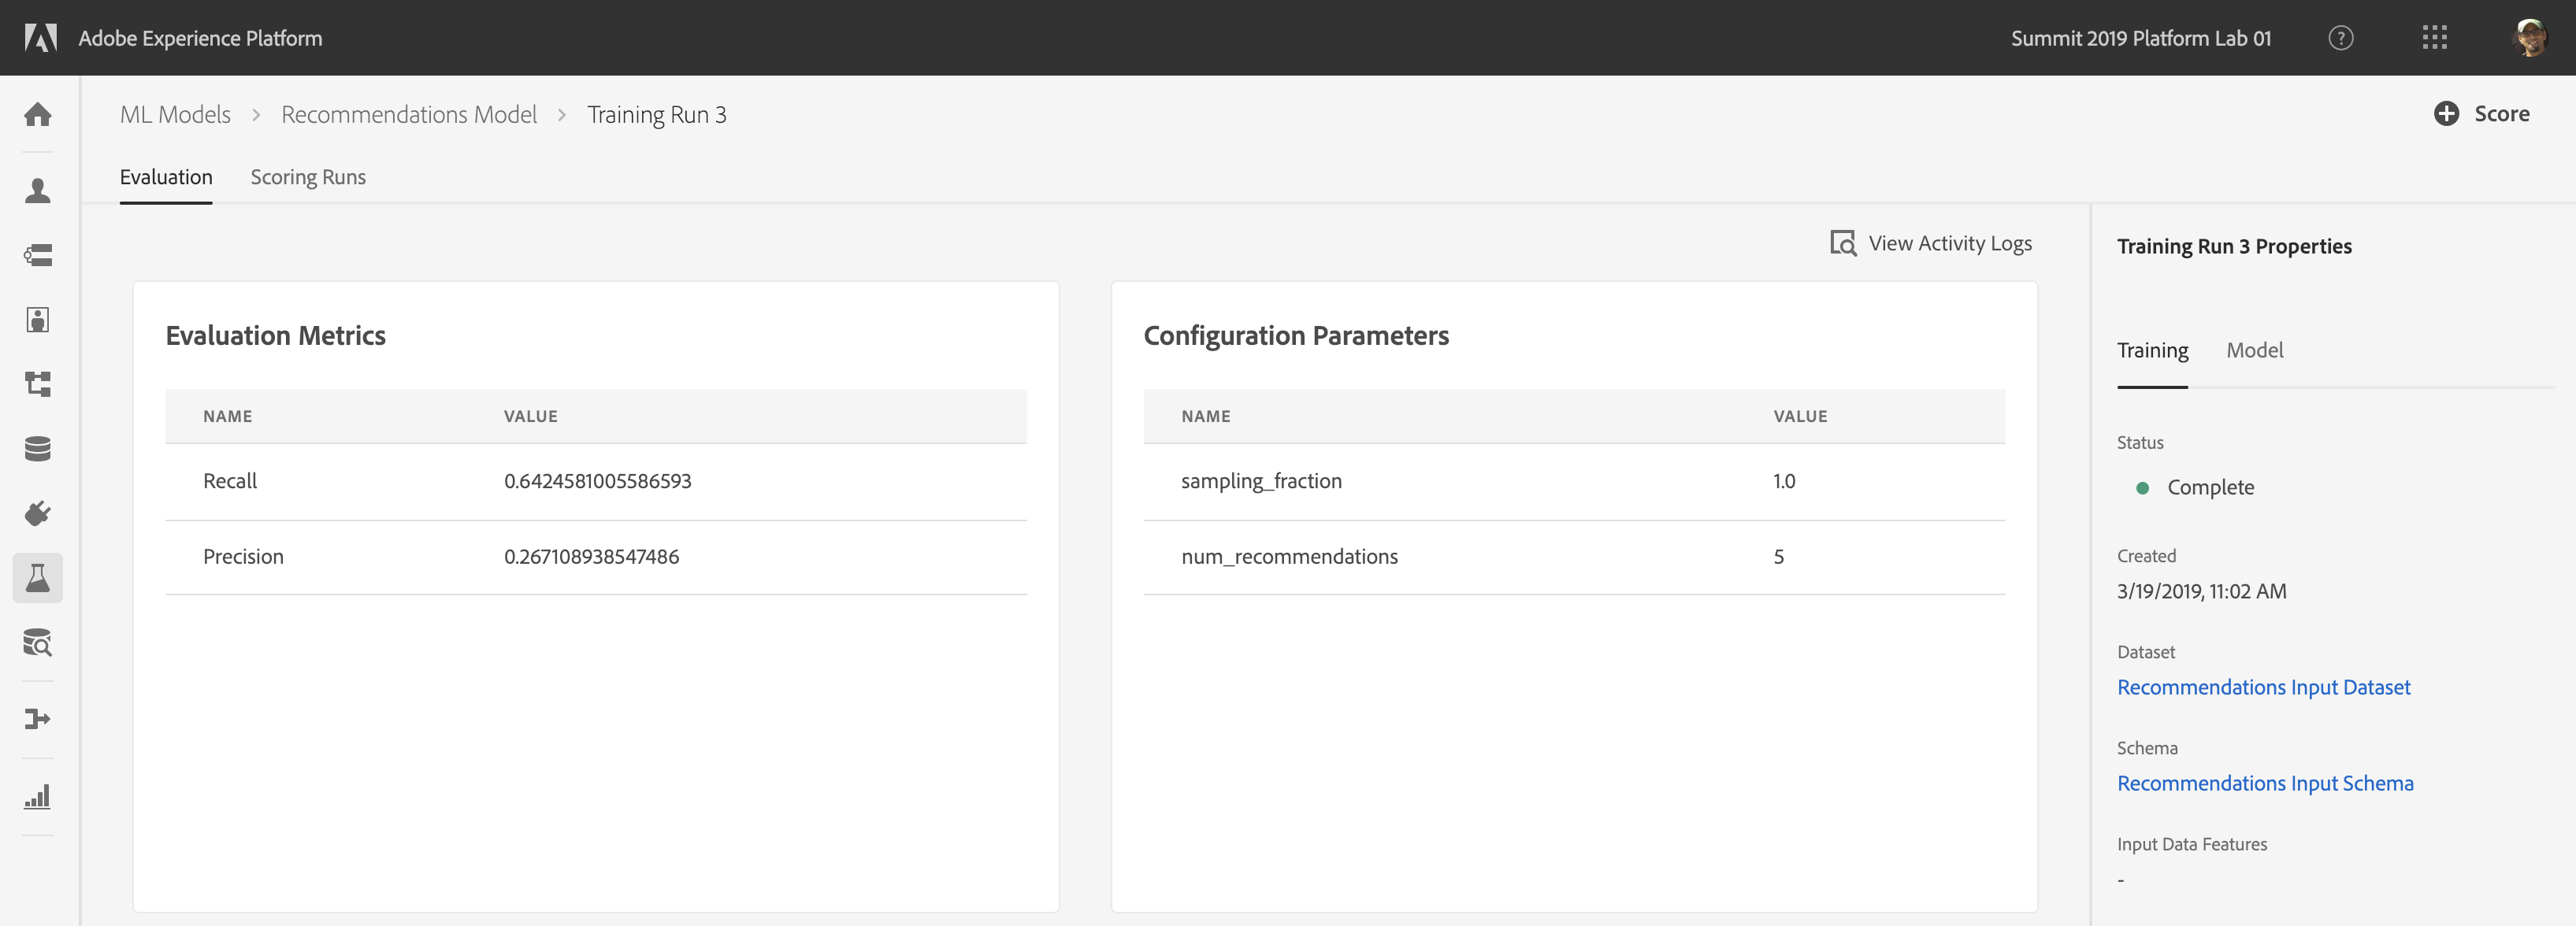
Review the Evaluation Metrics of Training Run by clicking on the Training Run name
Explore the information provided for each metric
You can see which features and hyper-parameters were used for each Experiment on the Configuration tab
(Optional) Create another experiment by following the steps in Exercise 4.2 and adjusting the hyper parameters
Select the Training Run from previous section. We will now use this training run to score a new dataset and generate recommendations
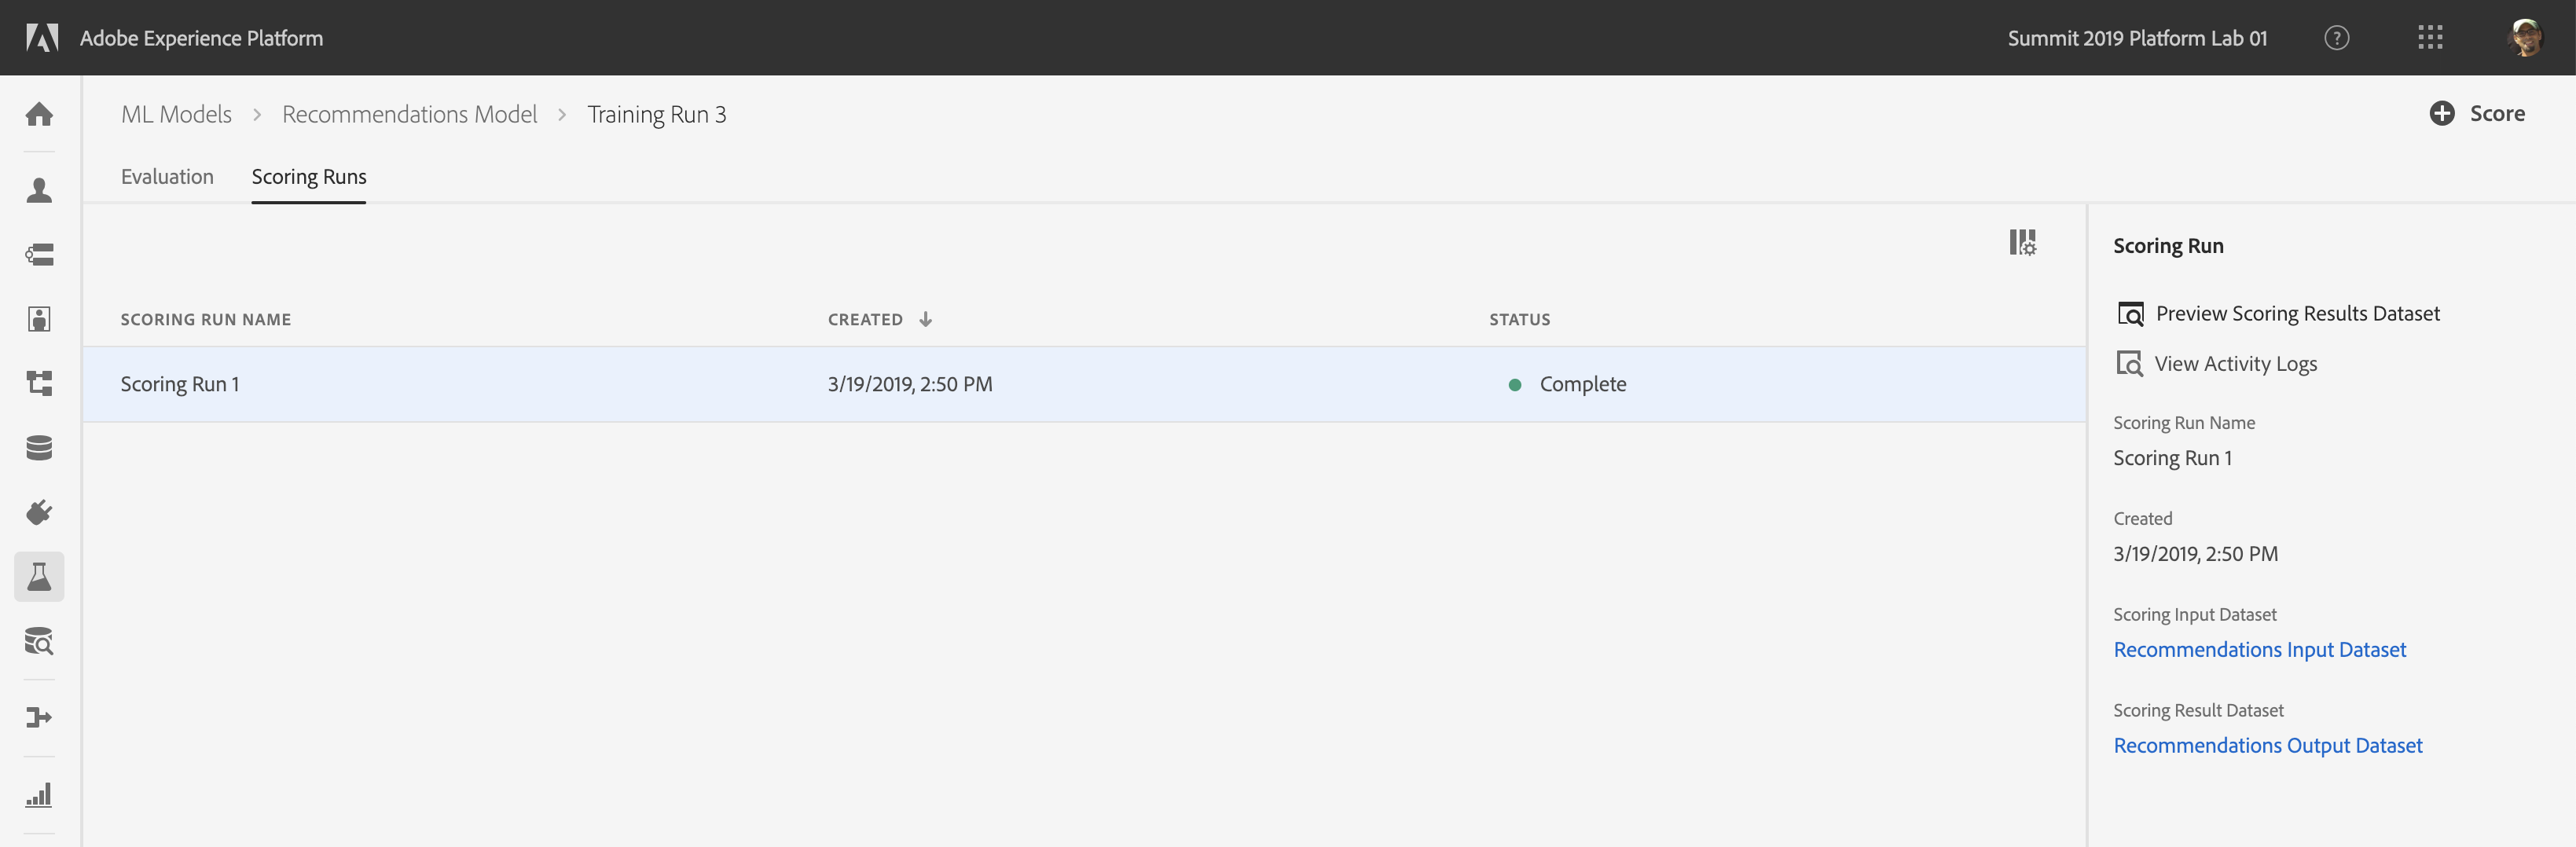
On the Training Run details page select the sub-tab Scoring Runs and click the button Score
For Data Source, select Recommendations Input Dataset. This is the same dataset we used earlier for training the model. Click Next.
For Scoring Output, select Recommendations Output Dataset. The model will populate this dataset with recommendations based on the input dataset from previous step. Click Next.
The configuration step allows you to configure this scoring run. Leave both num_recommendtions and sampling_fraction at their default values and click the Finish button to generate scoring output.
On the Scoring Runs tab, click the scoring run, and from the right hand rail, select Preview Scoring Results Dataset. You'll notice that the model identified top 5 popular across all LUMA users and added them to the recommended product list (delimited by the # sign)
New Scoring Run
The output dataset is already enabled for Unified Profile to activate the generated recommendations in Adobe Solutions.
Navigate on the Segments tab and click on Create Segment
Under Browse Attributes navigate to on Profile > Platformlab 01 > Recommendations
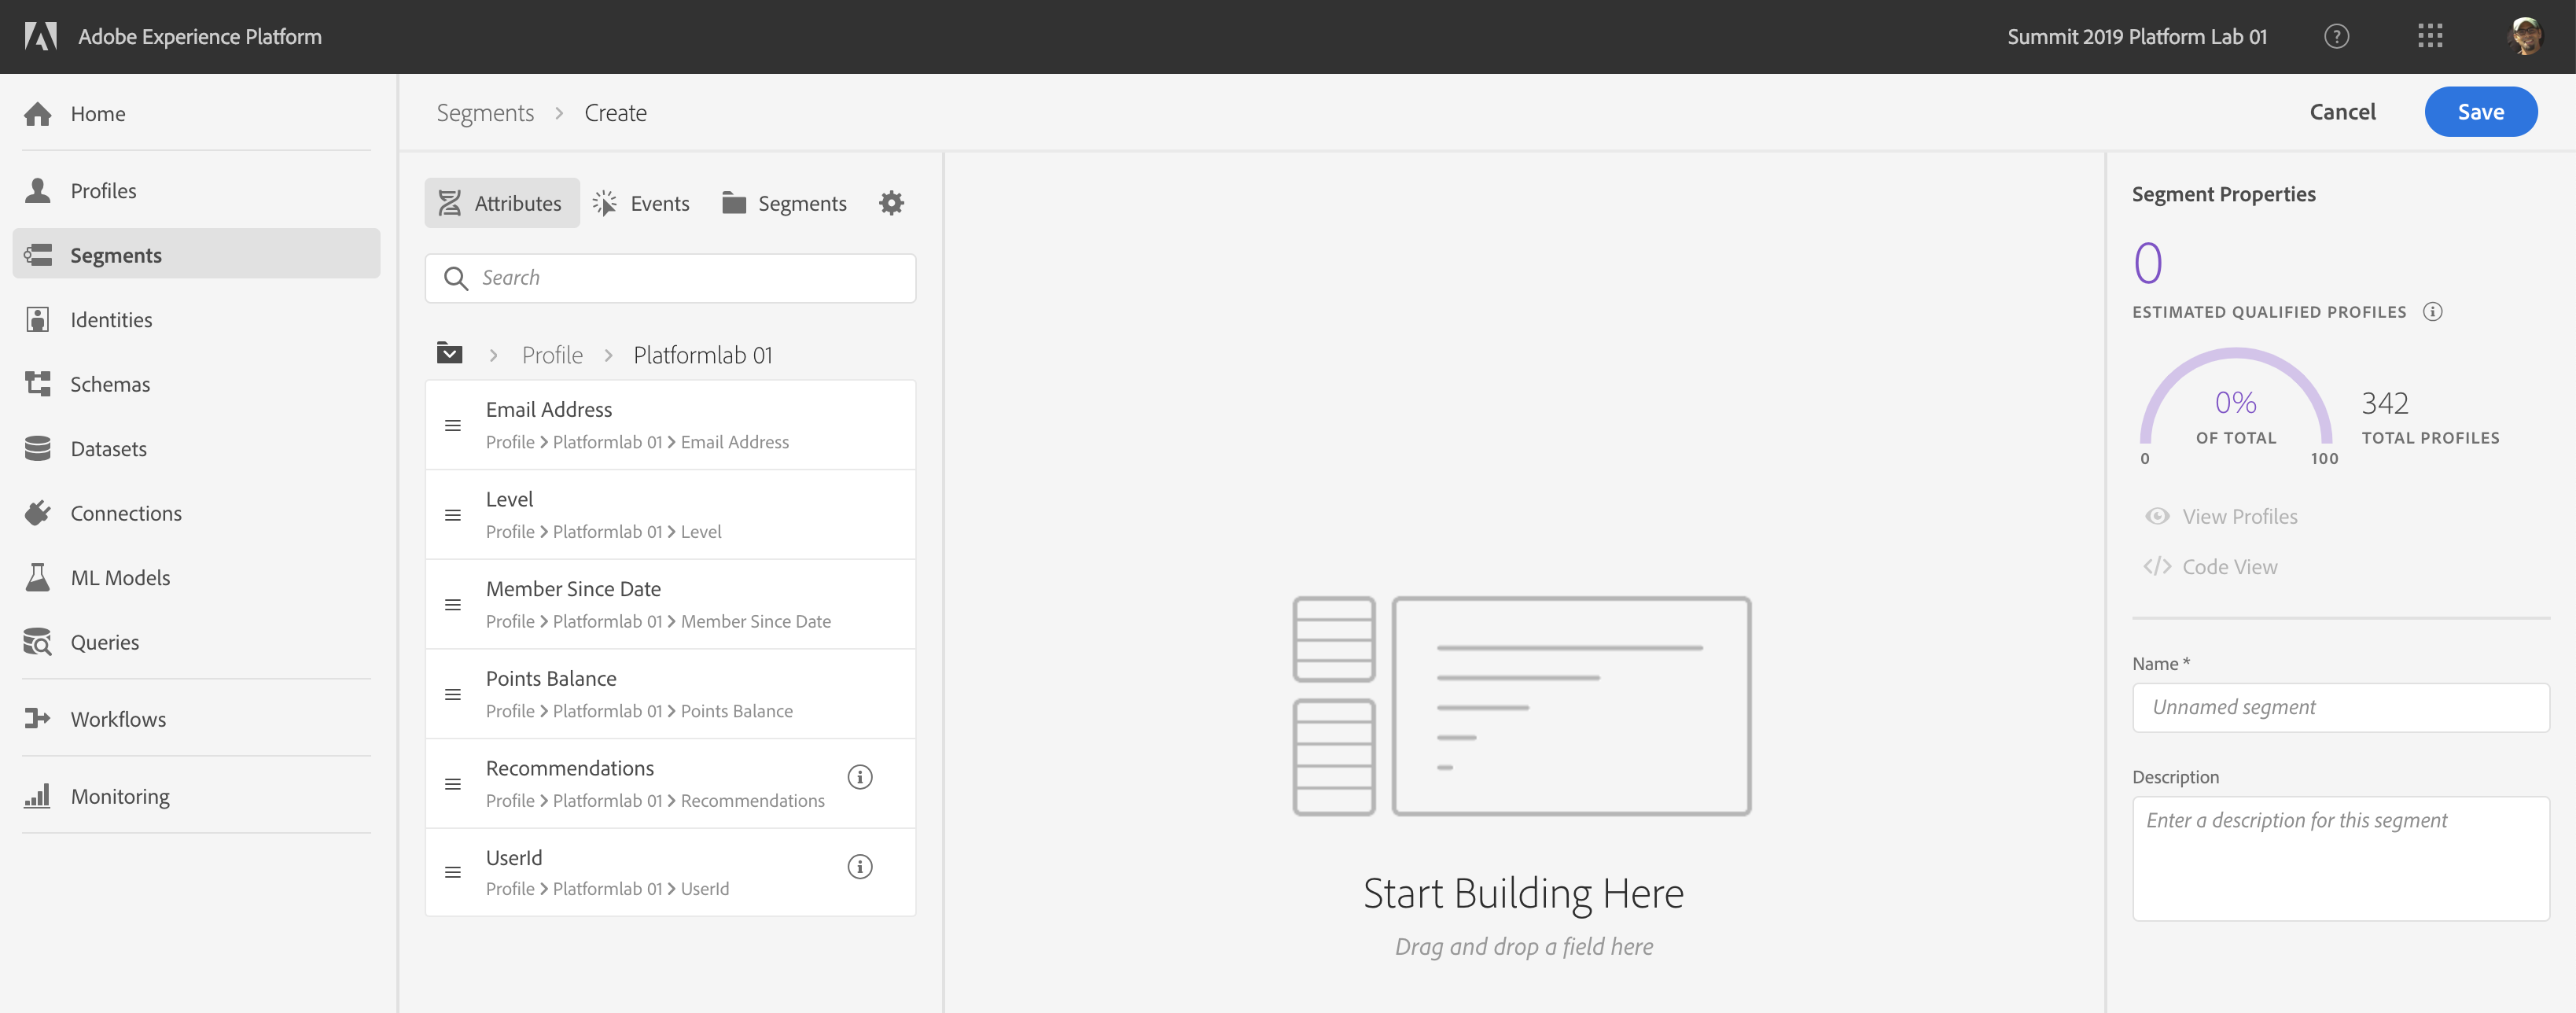
Select Recommendations and drag it into the design space in the center. Change the operator to contains and enter in the text box any of the SKUs that the model identified. As you do this, you should see the estimate on the right changing to show you how many profiles qualify into that segment.
🏆 Congratulations - You made it!
We would really appreciate your feedback at the survey link below. Survey respondents will be entered into a drawing for a $50 Amazon gift card. The survey will remain active until Monday, April 1, 2019: https://bit.ly/2UOvk69